eISSN: 2093-8462 http://jesk.or.kr
Open Access, Peer-reviewed
eISSN: 2093-8462 http://jesk.or.kr
Open Access, Peer-reviewed
Jinsung Jung
, Jaekyu Park
, Jaeho Choe
, Eui S. Jung
10.5143/JESK.2017.36.2.123 Epub 2017 April 28
Abstract
Objective: The objective of this study is to evaluate affection on how users perceive colors viewed from an automotive visual display according to cultural and radical differences including North America, Europe, and Southeast Asia. This study especially aims to identify effects of the variation of tone and chroma of representative color groups by analyzing affection differences depending on cultural and racial differences targeting the colors constituted through variation of tone and chroma, centered on representative colors.
Background: The colors of the menu, information display or background viewed through an automotive visual display are an important factor stimulating consumer's affection, and therefore an effort to express the vehicle's brand and product image through colors is made. The studies on colors focus only on the research on unique characteristics of colors, but an affective approach lacks according to cultural and racial differences on colors considering tone and chroma variation within a color from the currently used automotive visual displays.
Method: To grasp the visual affection felt by users, this study extracted affective adjectives related with colors through existing literature and a dictionary for adjectives, and presented human affection dimensions on colors through evaluation of various colors. Prior to carrying out affection evaluation, the basic light sources, red (R), green (G), and blue (B) constituting the colors used for automotive visual displays were defined as a representative color group, respectively. When colors in a color group are constituted, the evaluation target of each color group consisted of the colors considering the variation of tone and chroma by changing color sense through RGB values of the remaining two light sources. And then, this study carried out affection evaluation on the constituted colors targeting the subjects with cultural and racial differences.
Results: As a result of evaluating the constituted colors with representative affections, there were statistically significant differences between the groups having cultural and racial differences. As a result of S-N-K post-hoc analysis on the colors showing significant differences, North America and Europe were classified as heterogeneous groups. In some cases, Korea was classified as the homogeneous group with North America, but Korea was mainly classified as the homogenous group with Europe.
Conclusion: The representative affections on colors from an automotive visual display was drawn as three affective dimensions: passionate, neat, and masculine. Based on these, the affection of Korea and Europe on the constituted colors showed significant differences from that of North America, as a result of affection evaluation on the constituted colors viewed through the visual display by reflecting cultural and racial factors. Regarding representative color groups, bigger cultural and racial differences were revealed in terms of affection on red and green colors than on blue color, and variation of affection was the biggest in the red color.
Application: This study analyzed correlations of affection considering the colors constituted through variation of tone and chroma, and the culture and race in the representative color groups constituting a visual display. The results of this study are predicted to be utilized in coordination and selection of colors viewed from an automotive visual display taking into account culture and race.
Keywords
Color Affection Automotive visual display Cross-cultural
The visual display is a visual tool used the most in everyday life in various sizes and for diverse purposes including computers, smartphones, and smart watches. Because visual factor's weight is very high in performing an information outputting function, it is very important that a user visually perceives and feels a visual display (Kang et al., 2008). The colors are the most important factor in a visual display, and they not only play a role of survival and adaptation for humans, but hugely affect human's affection. The colors are a powerful means for communication beyond the boundaries of countries and languages, and they are utilized in overall fields of the marketing industry related with production, distribution, and consumption (Whang and Kwon, 2005).
A visual display in a vehicle was devised to deliver more information to drivers, and their importance becomes bigger, as the information volume increases with the output of vehicle's HMI (human-machine interface) system (Frost and Sullivan, 2006). In addition to navigation, the display technology has applied to cluster dashboard, and new visual display technologies apply fast to provide more information to drivers along with rapid development of the display technology (Kang, 2009). Therefore, the visual display software aspect based on ergonomic research, as well as simple visual display hardware technology, has become very important (Kang, 2009). Ergonomic studies considering the efficiency of information delivery and driver's attention dispersion are continuously carried out on visual displays. However, an approach from the affective aspect, and an affective approach on colors within a visual display are inadequate. In the visual displays used in computers, smartphones, and smart watches, individuals can select and change colors according to their own preferences; however, the selection and change of colors in an automotive visual display is greatly limited. The products produced in various countries and cultures co-exist in the markets, because national and cultural boundaries become obscure in buying a car including the visual display. For competition with such diverse products, user satisfaction needs to be enhanced. To do so, it is necessary to take into account the experiences of users in various cultures and races, and apply the experiences to products. In this regard, studies on the colors in an automotive visual display and also on cultures and races are required.
The colors are perceived the fastest among human's five senses, and the image on colors felt personally is known to have differences (Korea Institute of Design Promotion, 2003). A human perceives colors though creation of electric signals by chemical reactions in the visual pigment of a photoreceptor cell via a physical stimulus, namely light, and through projection of the signals to visual cortex in the occipital lobe of cerebral cortex via neural network (Korea Society of Color Studies, 2002). However, perception is not only determined by the output of physiological process, but perception is made by a cognitive process such as thinking and memory. The perception of colors is not only conducted by just neural cells' interactions, but perception of colors is made ultimately through the combination of psychological color images by a perceiving person's subjective experience (Derefeldt et al., 2004). In other words, human's perception of color image can be the perception of ultimately perceived colors classified with structural category by visual work through a process of perceiving with three factors of a color having initial stage color units, namely hue, colorfulness, and brightness (Derefeldt et al., 2004). The colors are differentiated through a perception process accepting colors and recognition of mental image together. The characteristics of a color are identified through natural and psychological association and affection via long time experience. Consequently, the differences of psychological preference and perception on colors occur due to personal experience and environment (Kim and Lee, 2005).
Mahnke (1996) classified human's experience on colors into six stages: biological response to color stimulus, collective unconsciousness, conscious symbolization, cultural impact, the impact of trend in the contemporary era, and personal relationship. Mahnke said that the affection on colors always exists in the context of interactions of individuals, society, and culture trough such color experience stages, and that color experience on various dimensions affects the formation of subjective and objective preferences for colors. Individual's affection on colors is made by perception primarily, but it can be continuously reinterpreted and reconstituted in the human's consciousness structure according to social, cultural, and environmental context change (Whang and Kwon, 2005). As for preference for colors, the environmental factors should be considered, because the association and concept on colors have differences according to ethnic and regional factors, and they change depending on era (Kim and Choi, 2010; Park, 2000).
Affection refers to a subjective feeling experienced on an object or environment, and therefore, it lasts a long time, unlike emotion accompanied by qualitative evaluation like affirmation or negation (Lee, 1997). To apply affection to actual products, a process to systematize relationship with human's psychological response to a physical subject should be preceded by extracting basic affection on a subject primarily, and by identifying relevant physical attributes (Lim et al., 2004). In this regard, there is a need to identify and perceive physical attributes of a subject, and grasp how they are connected with psychological responses. Norman (2005) explained affection perception levels with the following three levels: a visceral level in which human body response is revealed by deciding good or bad upon experiencing something, or by judging a risk, a behavior level in which joy or efficiency acquired through use is said, and a reflective level in which an experience is judged by personal satisfaction or memory, because consciousness, feeling, affection, and perception exist (Lee and Suk, 2012). The reason why personal satisfaction is important in user experience is that affection is formed in the process that brain receives and judges sense and then takes an action, and thus personal satisfaction and experience in the reflective level affect affection perception through the reflective level. Consequently, there is a need to consider personal satisfaction in user experience in order to extract positive affection.
Studies on affection on colors have been conducted being divided into three categories: preference for specific colors, image evaluation on colors, and the extraction of representative affection factors targeting color image (Yi and Choi, 2009). Valdez and Mehrabian (1994) actively carried out a study on the effect of affection that a single color has with a 3D affection model. Osgood et al. (1957) said evaluation, activity, and potential attributes exist in the affection on colors. Wright and Rainwater (1962) extracted color factors including happiness and grace. Ou et al. (2004) classified color factors as activity, weight, and heat, and asserted that weight can be quantified depending on the brightness of a color. Gao and Xin (2006) reported that soft feeling or color's light feeling is mainly related with the brightness of a color. Studies examining cultural and racial differences in the affection on colors have been continuously carried out. In addition to the studies of Davies and Corbett (1997) and Adams and Osgood (1973), studies on the preference aspect of various colors, and the characteristics of each culture and race have been performed actively. Most studies, however, have been carried out by discussing the characteristics of the colors preferred by each culture and race, or by focusing on the countries much affected by Europe in terms of grouping of colors. Therefore, those studies have been conducted targeting the cultures and races regarded as the same cultural area, although they are physically different countries or races. Most studies on the affection of colors have been performed on just general representative colors including red, orange, gray, and black, and thus no minute differences reflecting variation in tone and chroma in one color group have not been revealed. Also, studies on colors through visual displays are inadequate, since the evaluation subjects are mainly clothes and lighting. As the reflection of users' experiences to products becomes important, the need to apply colors to each culture or race increases, although minute differences are revealed visually in the same color group, when a color is expressed in a visual display by identifying psychological characteristics and cultural and racial differences.
The objective of this study is as follows: building an evaluation system for adjectives expressing affection, selecting the adjectives describing subjective psychological state, namely affection, drawing representative affections on the colors expressed in an automotive visual display, and identifying the affective effects on cultural and racial differences according to variation in tone and chroma depending on RGB values.
2.1 Deduction of affection dimensions
To deduct affection dimensions to carry out affection evaluation on the colors viewed from an automotive visual display, 230 adjectives considered to be related with the colors viewed from a visual display were collected through existing color-related literature (Lim et al., 2004; Jee et al., 2006; Song, 2007; Jung and Nah, 2007; Park, 2008; Jang et al., 2009; Park and Song, 2014; Lee, 2016), a dictionary for adjectives, and design expert interviews in this study. Concerning the 230 adjectives collected primarily, 98 males and females in their 20s and 30s were instructed to express the adjectives related with colors viewed from a visual display, after showing various colors through the visual display targeting those 98 males and females. The colors were systematically selected in consideration of the Munsell color order system. This study used Apple's tablet PC, iPad Pro 9.7, as the visual display be reflecting a trend that automotive visual display's size becomes gradually bigger. As a result of the first relevance evaluation, 97 adjectives with 7.02 or higher expectation frequency that expresses well the colors correlation in the visual display were selected. And then, among the affective adjectives related with the colors in the visual display, similar or opposite words were integrated though focused group interview. Targeting 34 integrated adjectives, this study carried out the second correlation evaluation with a 7-poing Likert scale. In the second correlation evaluation, various colors were shown through the visual display. As a result, this study selected 15 affective adjectives, showing 4 point (median value) or higher correlation, which are related with the colors in the visual display as shown in Table 1.
|
Color-related affective adjectives
on visual display |
|
Near, intense, rough, bold,
neat, unique, dynamic, warm, hard, bright, inattentive, clear,
three-dimensional, modern, and fancy |
Based on the 15 selected affective adjectives, this study carried out affection evaluation on 15 various colors with a 7-point Likert scale targeting 75 males and females in their 20s and 30s in order to select the common factors of explorative factor analysis on the mutually correlated affective adjectives as representative affections. The colors were expressed through the same Apple's iPad Pro 9.7 visual display used in the first and second evaluations. A statistical analysis was carried out using IBM's SPSS Statistics 24. To confirm the validity of representative affections in the factor analysis, the eigen value was based on 1. The factor analysis was conducted on the basis of 0.6, the criterion generally used in the social sciences in terms of communality. As a result of the factor analysis based on the criteria above, three factors explained 73.3% of total variance as shown in Table 2. The first factor consisted of "intense, bold, warm, and fancy", and was denominated as passionate dimension. The second factor consisted of "neat, clear, and bright", and denominated as neat dimension. The third factor consisted of "hard and rough", and was denominated as masculine dimension.
The definition of the representative affections deducted through an exploratory factory analysis is shown in Table 3. The representative affections and definitions were provided by translation into English for the subjects in North America and Europe. Because the existing meaning of a word may be different from the meaning defined in this study, the defined meaning was continuously reminded of in this study.
|
|
1st factor |
2nd factor |
3rd factor |
Communality |
|
Passionate |
Neat |
Masculine |
||
|
Intense |
0.856 |
|
|
0.791 |
|
Bold |
0.801 |
|
|
0.748 |
|
Warm |
0.786 |
|
|
0.778 |
|
Fancy |
0.677 |
|
|
0.713 |
|
Neat |
|
0.807 |
|
0.661 |
|
Clear |
|
0.803 |
|
0.803 |
|
Bright |
|
0.724 |
|
0.730 |
|
Hard |
|
|
0.881 |
0.701 |
|
Rough |
|
|
0.704 |
0.674 |
|
Total variance explained (%) |
32.033 |
23.949 |
17.329 |
Total 73.311% |
|
Representative affection |
Definition of representative affection |
|
Passionate |
If a color is passionate,
it is intense, fancy, bold, and warm |
|
Fresh |
If a color is fresh, it is
clean, vivid, and bright |
|
Masculine |
If a color is masculine, it
is rough and solid (or firm) |
2.2 Subjects
To carry out affection evaluation on the colors from a visual display, those in their 20s and 30s without color blindness or color weakness participated in the experiment of this study. For evaluation on colors, this study checked whether color could be discerned using the Mundell color order system, and based on those who had no problems in visual sense, evaluation, and color differentiation. To identify cultural and racial differences, this study recruited the subjects on the basis of balance in gender as follows: North America (the U.S. and Canada), Europe (the Netherlands, Germany, Belgium, Sweden, and France), and East Asia (Korea) with 48 people (27 males and 21 females), 33 people (15 males and 18 females) and 81 people (38 males and 43 females).
2.3 Experimental environment and equipment
To conduct affection evaluation on the colors viewed from an automotive visual display, this study used Apple's iPad Pro 9.7 visual display. The effect of illuminance was minimized by controlling the brightness of the visual display and the lighting of the experimental environment, and the surrounding environment consisted of achromatic color. The visual display was installed in a stand type as shown in Figure 1 in consideration of the visual display's shape installed in a vehicle so that the lighting source of the experimental environment cannot be directly seen.

2.4 Experimental stimulus
Concerning the stimulus used for affection evaluation, this study carried out on colors, excluding design factors, since there are diverse design factors including menu, information, display, and background according to manufacturer or product. The stimulating colors were constituted by offering variation in tone and chroma through a method to reduce the remaining two colors to a certain level from each color group based on the red, green, and blue colors, which are three RGB colors (three primary colors) of light. Among the three RGB colors, the additive color mixture of red and green produces yellow light. If the yellow light is mixed with blue light, one of the three RGB colors, again using the additive color mixture, it becomes white light (Lee, 2013). As such, various color combinations can be made depending on the color combination and mixture level of the red, green, and blue colors, and such a color expression method is called RGG additive color mixture. TVs and computers use the additive color mixture, and the color expression of Web documents like HTML also uses this additive color mixture method. Therefore, a study on the three RGB colors of light that become the basis of various colors combination should be preceded for affection identification on the colors from a visual display.
The RGB additive color mixture method sets up each light source's minimum value as 0 and maximum value as 255, divides each light source by 256 levels, and expresses colors with the combination of 256 levels of red, green, and blue, respectively. To constitute the stimulating colors used for evaluation, this study set up the red, green, and blue colors, which became the standard color of each color group. Because the red, green, and blue colors' each primary color is different from the general red, green, and blue used in everyday life, this study converted the colors set forth in the Korean Industrial Standard as RGB values, instead of each light source's primary color.
The control level of each light source was set up by evaluating the colors expressed on the visual display in various levels targeting 10 subjects. As a result of the evaluation, the colors expressed through the visual display could be differentiated with the naked eye and from the representative affection aspect in the variation of 32 levels, when one light source was divided by 256 levels. Based on this, stimuli were constituted as shown in Table 4, based on the RGB values of the red, green, and blue colors of the Korean Industrial Standard.
2.5 Experimental procedure
The affection evaluation on the colors viewed from an automotive visual display was carried out in Korean targeting East Asian subjects and in English targeting the North American and European subjects. The experiment of this study consisted of the preparation stage, evaluation stage, and break time in the evaluation stage. In the preparation stage, the purpose and procedure of the experiment were adequately explained to the subjects, and also they were reminded of the definition at representative affection dimension. In the experiment stage, evaluation on each representative affection dimension was carried out, after looking at the expressed colors through the visual display for a minute. The evaluation was conducted with a 7-point Likert scale questionnaire, which is a self-reporting type in measuring affective response in the reflective level, one of the affective perception levels of brain presented by Norman (2005). This study controlled the impact of exogenous variables that can be generated during the evaluation through random order of colors expressed through the visual display. The experiment time was about 40 minutes, and break time was offered in between the evaluation time, and the impact that can be given by previous color was controlled.
|
No. |
Color |
R |
G |
B |
No. |
Color |
R |
G |
B |
No. |
Color |
R |
G |
B |
|
R1 |
|
242 |
0 |
0 |
G1 |
|
21 |
141 |
69 |
B1 |
|
6 |
111 |
175 |
|
R2 |
|
242 |
32 |
0 |
G2 |
|
85 |
141 |
69 |
B2 |
|
38 |
111 |
175 |
|
R3 |
|
242 |
64 |
0 |
G3 |
|
53 |
141 |
69 |
B3 |
|
70 |
111 |
175 |
|
R4 |
|
242 |
0 |
32 |
G4 |
|
21 |
141 |
101 |
B4 |
|
6 |
143 |
175 |
|
R5 |
|
242 |
32 |
32 |
G5 |
|
85 |
141 |
101 |
B5 |
|
38 |
143 |
175 |
|
R6 |
|
242 |
64 |
32 |
G6 |
|
53 |
141 |
101 |
B6 |
|
70 |
143 |
175 |
|
R7 |
|
242 |
0 |
64 |
G7 |
|
21 |
141 |
37 |
B7 |
|
6 |
79 |
175 |
|
R8 |
|
242 |
32 |
64 |
G8 |
|
85 |
141 |
37 |
B8 |
|
38 |
79 |
175 |
|
R9 |
|
242 |
64 |
64 |
G9 |
|
53 |
141 |
37 |
B9 |
|
70 |
79 |
175 |
To analyze the differences of color perception expressed through the visual display in terms of culture and race depending on the colors reflecting tone and chroma, this study conducted a variance analysis to check whether culture and race according to each constituted color have a significant effect on representative affections. As for the colors, the classification names used in Table 4 were used, and the groups were called the North America for North American region, Europe for European region, and Korea for East Asian region.
The variance analysis results are shown in Tables 5, 6, and 7. To show each group's evaluation result on each affection, the mean and standard deviation were used together with the S-N-K post-hoc analysis result. The differences of the mean between the groups with cultural and racial differences on R1, R2, R3, R7, and R8 for passionate, R1, R2, R3, R5, R9 for neat, and R3, R6, R9 for masculine as shown in Table 5 on the red color group showed significant differences at the significance level of 0.05 (p-value<0.05). The differences of the mean between the groups with cultural and racial differences on G2, G3, G4, G6, G7, G8, G9, for passionate, G6 for neat, and G1, G2, G3, G8, G9 for masculine as shown in Table 5 on the red color group showed significant differences at the significance level of 0.05 (p-value<0.05). Lastly, the differences of the mean between the groups with cultural and racial differences on B4, B5, and B9 for passionate, B4 and B9 for neat, and B9 for masculine as shown in Table 7 on the blue color group showed significant differences at the significance level of 0.05 (p-value<0.05).
According to the post-hoc analysis of S-N-K, North America was classified as A group, and Europe and Korea were classified as B group on R1 and R2 for passionate, and North America and Europe were classified as A group, and Korea was classified as B group on R3, R7 and R8 as shown in Table 5 on the red color group. Europe was classified as A group, and North America and Korea as B group on R1, R2, R3 and R9 for neat. North America, Europe, and Korea all were classified as other groups on R3 for masculine, and Europe and Korea were classified as A group, and North America as B group on R6 and R9. Korea was classified as A group, and North America and Europe as B group on G2 and G3 for passionate, and Europe and Korea were classified as A group, and North America as B group on G4, G6, G7, G8, and G9 as shown in Table 6 on the green color group. For neat, Europe and Korea were classified as A group, and North Korea as B group on G6. For neat, Korea was classified as A group, and North America and Europe as B group on G1 and G3. Europe and Korea were classified as A group, and North America as B group on G2, G8, and G9. Lastly, Europe and Korea were classified as A group, and North America as B group on B4, B5, and B9 for passionate as shown in Table 7 on the blue color group , and Europe and Korea were classified as A group, and North America as B group on B4 and B9 for neat. For masculine, North America, Europe, and Korea showed statistical differences on B9, but they were classified as the homogenous group. In synthesizing the S-N-K post-hoc analysis result, North America and Europe were classified as the heterogeneous groups, and Korea was classified as the homogeneous group with Europe, although Korea was classified as the homogeneous group with North America in some cases.
|
Representative |
Color |
Group |
Mean |
Standard deviation |
p |
S-N-K post analysis |
|
Passionate |
R1 |
North America |
5.89 |
0.78 |
0.02(*) |
A |
|
Europe |
6.14 |
1.29 |
B |
|||
|
Korea |
6.60 |
0.65 |
B |
|||
|
R2 |
North America |
5.00 |
1.22 |
0.00(*) |
A |
|
|
Europe |
5.64 |
1.50 |
B |
|||
|
Korea |
6.21 |
0.84 |
B |
|||
|
R3 |
North America |
4.00 |
1.22 |
0.00(*) |
A |
|
|
Europe |
4.45 |
1.65 |
A |
|||
|
Korea |
5.00 |
0.00 |
B |
|||
|
R4 |
North America |
6.33 |
0.50 |
0.07 |
A |
|
|
Europe |
6.57 |
0.65 |
A |
|||
|
Korea |
6.00 |
0.94 |
A |
|||
|
R5 |
North America |
5.33 |
0.71 |
0.21 |
A |
|
|
Europe |
6.07 |
0.83 |
A |
|||
|
Korea |
5.74 |
1.03 |
A |
|||
|
R6 |
North America |
4.00 |
1.32 |
0.08 |
A |
|
|
Passionate |
R6 |
Europe |
3.64 |
1.60 |
0.08 |
A |
|
Korea |
4.54 |
1.34 |
A |
|||
|
R7 |
North America |
6.78 |
0.44 |
0.01(*) |
B |
|
|
Europe |
5.21 |
1.81 |
A |
|||
|
Korea |
5.16 |
1.49 |
A |
|||
|
R8 |
North America |
6.33 |
0.50 |
0.04(*) |
B |
|
|
Europe |
5.14 |
1.56 |
A |
|||
|
Korea |
5.07 |
1.39 |
A |
|||
|
R9 |
North America |
4.00 |
1.32 |
0.28 |
A |
|
|
Europe |
4.07 |
1.90 |
A |
|||
|
Korea |
4.65 |
1.46 |
A |
|||
|
Neat |
R1 |
North America |
5.44 |
1.01 |
0.01(*) |
B |
|
Europe |
3.50 |
2.07 |
A |
|||
|
Korea |
4.91 |
1.53 |
B |
|||
|
R2 |
North America |
4.11 |
1.36 |
0.00(*) |
B |
|
|
Europe |
3.14 |
1.61 |
A |
|||
|
Korea |
4.95 |
1.44 |
B |
|||
|
R3 |
North America |
4.67 |
1.50 |
0.00(*) |
B |
|
|
Europe |
3.50 |
1.70 |
A |
|||
|
Korea |
5.00 |
0.00 |
B |
|||
|
R4 |
North America |
4.89 |
1.83 |
0.10 |
A |
|
|
Europe |
4.00 |
1.88 |
A |
|||
|
Korea |
4.98 |
1.34 |
A |
|||
|
R5 |
North America |
4.89 |
1.36 |
0.03(*) |
A |
|
|
Europe |
3.71 |
1.94 |
A |
|||
|
Korea |
4.95 |
1.42 |
A |
|||
|
R6 |
North America |
4.22 |
0.97 |
0.08 |
A |
|
|
Europe |
3.57 |
1.34 |
A |
|||
|
Korea |
4.51 |
1.42 |
A |
|||
|
R7 |
North America |
5.89 |
1.05 |
0.11 |
B |
|
|
Europe |
4.43 |
2.34 |
A |
|||
|
Korea |
5.05 |
1.43 |
B |
|||
|
R8 |
North America |
5.11 |
1.17 |
0.77 |
A |
|
|
Neat |
R8 |
Europe |
4.64 |
2.10 |
0.77 |
A |
|
Korea |
4.79 |
1.44 |
A |
|||
|
R9 |
North America |
5.00 |
1.94 |
0.04(*) |
B |
|
|
Europe |
3.43 |
1.91 |
A |
|||
|
Korea |
4.46 |
1.66 |
B |
|||
|
Masculine |
R1 |
North America |
4.78 |
1.64 |
0.44 |
A |
|
Europe |
3.93 |
1.59 |
A |
|||
|
Korea |
4.05 |
1.71 |
A |
|||
|
R2 |
North America |
4.56 |
1.59 |
0.13 |
A |
|
|
Europe |
3.21 |
1.48 |
A |
|||
|
Korea |
3.68 |
1.55 |
A |
|||
|
R3 |
North America |
4.78 |
1.09 |
0.00(*) |
A |
|
|
Europe |
3.00 |
1.57 |
B |
|||
|
Korea |
4.00 |
0.00 |
C |
|||
|
R4 |
North America |
4.22 |
1.79 |
0.51 |
A |
|
|
Europe |
3.36 |
1.78 |
A |
|||
|
Korea |
3.74 |
1.74 |
A |
|||
|
R5 |
North America |
4.00 |
1.32 |
0.67 |
A |
|
|
Europe |
3.43 |
1.40 |
A |
|||
|
Korea |
3.74 |
1.59 |
A |
|||
|
R6 |
North America |
5.33 |
1.22 |
0.00(*) |
B |
|
|
Europe |
2.86 |
1.35 |
A |
|||
|
Korea |
3.23 |
1.49 |
A |
|||
|
R7 |
North America |
3.44 |
1.42 |
0.18 |
A |
|
|
Europe |
2.21 |
1.12 |
A |
|||
|
Korea |
2.75 |
1.65 |
A |
|||
|
R8 |
North America |
3.22 |
1.39 |
0.24 |
A |
|
|
Europe |
2.21 |
1.53 |
A |
|||
|
Korea |
2.84 |
1.50 |
A |
|||
|
R9 |
North America |
4.22 |
1.39 |
0.01(*) |
B |
|
|
Europe |
2.29 |
0.99 |
A |
|||
|
Korea |
2.82 |
1.50 |
A |
|
Representative |
Color |
Group |
Mean |
Standard deviation |
p |
S-N-K post analysis |
|
Passionate |
G1 |
North America |
4.00 |
1.87 |
0.14 |
A |
|
Europe |
3.57 |
1.83 |
A |
|||
|
Korea |
2.96 |
1.56 |
A |
|||
|
G2 |
North America |
4.00 |
2.06 |
0.02(*) |
B |
|
|
Europe |
2.93 |
1.44 |
B |
|||
|
Korea |
2.46 |
1.40 |
A |
|||
|
G3 |
North America |
4.67 |
1.73 |
0.04(*) |
B |
|
|
Europe |
3.50 |
1.45 |
B |
|||
|
Korea |
3.19 |
1.69 |
A |
|||
|
G4 |
North America |
4.89 |
2.09 |
0.00(*) |
B |
|
|
Europe |
2.50 |
1.16 |
A |
|||
|
Korea |
2.88 |
1.66 |
A |
|||
|
G5 |
North America |
2.89 |
1.76 |
0.09 |
B |
|
|
Europe |
1.64 |
0.74 |
B |
|||
|
Korea |
2.12 |
1.34 |
A |
|||
|
G6 |
North America |
5.11 |
1.69 |
0.01(*) |
B |
|
|
Europe |
4.64 |
1.69 |
A |
|||
|
Korea |
4.16 |
1.58 |
A |
|||
|
G7 |
North America |
5.22 |
2.05 |
0.03(*) |
A |
|
|
Europe |
4.43 |
1.99 |
A |
|||
|
Korea |
3.63 |
1.76 |
A |
|||
|
G8 |
North America |
4.11 |
1.69 |
0.04(*) |
B |
|
|
Europe |
2.93 |
1.49 |
A |
|||
|
Korea |
2.79 |
1.46 |
A |
|||
|
G9 |
North America |
4.33 |
1.87 |
0.03(*) |
B |
|
|
Europe |
3.36 |
2.02 |
A |
|||
|
Korea |
2.86 |
1.42 |
A |
|||
|
Neat |
G1 |
North America |
5.67 |
1.00 |
0.07 |
A |
|
Europe |
5.07 |
1.77 |
A |
|||
|
Korea |
4.51 |
1.50 |
A |
|||
|
G2 |
North America |
4.33 |
1.80 |
0.18 |
A |
|
|
Europe |
3.00 |
1.57 |
A |
|||
|
Korea |
3.37 |
1.71 |
A |
|||
|
Neat |
G3 |
North America |
5.00 |
1.87 |
0.37 |
A |
|
Europe |
4.57 |
1.65 |
A |
|||
|
Korea |
4.28 |
1.37 |
A |
|||
|
G4 |
North America |
5.22 |
1.20 |
0.05 |
A |
|
|
Europe |
4.86 |
1.92 |
A |
|||
|
Korea |
4.07 |
1.50 |
A |
|||
|
G5 |
North America |
3.56 |
2.01 |
0.34 |
A |
|
|
Europe |
2.71 |
1.44 |
A |
|||
|
Korea |
2.72 |
1.58 |
A |
|||
|
G6 |
North America |
5.22 |
1.48 |
0.03(*) |
B |
|
|
Europe |
3.71 |
1.64 |
A |
|||
|
Korea |
3.72 |
1.56 |
A |
|||
|
G7 |
North America |
6.11 |
1.36 |
0.24 |
A |
|
|
Europe |
5.00 |
1.92 |
A |
|||
|
Korea |
5.21 |
1.56 |
A |
|||
|
G8 |
North America |
5.00 |
1.66 |
0.071 |
B |
|
|
Europe |
3.50 |
1.95 |
B |
|||
|
Korea |
3.84 |
1.44 |
A |
|||
|
G9 |
North America |
4.56 |
1.81 |
0.48 |
A |
|
|
Europe |
3.71 |
1.90 |
A |
|||
|
Korea |
4.04 |
1.52 |
A |
|||
|
Masculine |
G1 |
North America |
5.33 |
1.50 |
0.00(*) |
B |
|
Europe |
5.29 |
0.91 |
B |
|||
|
Korea |
4.23 |
1.30 |
A |
|||
|
G2 |
North America |
5.89 |
0.78 |
0.00(*) |
B |
|
|
Europe |
4.79 |
1.12 |
A |
|||
|
Korea |
4.07 |
1.61 |
A |
|||
|
G3 |
North America |
5.44 |
1.13 |
0.02(*) |
B |
|
|
Europe |
4.86 |
1.03 |
B |
|||
|
Korea |
4.23 |
1.32 |
A |
|||
|
G4 |
North America |
4.89 |
1.62 |
0.38 |
A |
|
|
Europe |
4.07 |
1.73 |
A |
|||
|
Korea |
4.18 |
1.42 |
A |
|||
|
Masculine |
G5 |
North America |
5.22 |
0.83 |
0.13 |
A |
|
Europe |
4.36 |
1.98 |
A |
|||
|
Korea |
4.02 |
1.68 |
A |
|||
|
G6 |
North America |
5.11 |
1.69 |
0.20 |
A |
|
|
Europe |
4.64 |
1.69 |
A |
|||
|
Korea |
4.16 |
1.58 |
A |
|||
|
G7 |
North America |
4.67 |
1.80 |
0.43 |
A |
|
|
Europe |
4.43 |
1.28 |
A |
|||
|
Korea |
4.04 |
1.58 |
A |
|||
|
G8 |
North America |
5.44 |
1.42 |
0.01(*) |
B |
|
|
Europe |
4.57 |
1.45 |
A |
|||
|
Korea |
3.91 |
1.44 |
A |
|||
|
G9 |
North America |
5.44 |
1.13 |
0.01(*) |
B |
|
|
Europe |
4.14 |
1.56 |
A |
|||
|
Korea |
3.96 |
1.36 |
A |
|
Representative |
Color |
Group |
Mean |
Standard deviation |
p |
S-N-K post analysis |
|
Passionate |
B1 |
North America |
4.56 |
1.94 |
0.38 |
A |
|
Europe |
3.50 |
2.03 |
A |
|||
|
Korea |
3.70 |
1.80 |
A |
|||
|
B2 |
North America |
4.89 |
1.62 |
0.18 |
A |
|
|
Europe |
3.86 |
2.14 |
A |
|||
|
Korea |
3.65 |
1.79 |
A |
|||
|
B3 |
North America |
4.67 |
2.12 |
0.06 |
A |
|
|
Europe |
3.21 |
1.81 |
A |
|||
|
Korea |
3.12 |
1.76 |
A |
|||
|
B4 |
North America |
4.89 |
2.09 |
0.01(*) |
B |
|
|
Europe |
3.86 |
1.83 |
A |
|||
|
Korea |
3.04 |
1.51 |
A |
|||
|
Passionate |
B5 |
North America |
4.78 |
1.56 |
0.01(*) |
B |
|
Europe |
3.71 |
2.02 |
A |
|||
|
Korea |
3.04 |
1.46 |
A |
|||
|
B6 |
North America |
3.78 |
1.72 |
0.07 |
B |
|
|
Europe |
2.21 |
1.37 |
A |
|||
|
Korea |
2.74 |
1.56 |
A |
|||
|
B7 |
North America |
5.67 |
2.06 |
0.32 |
A |
|
|
Europe |
4.86 |
2.14 |
A |
|||
|
Korea |
4.53 |
2.15 |
A |
|||
|
B8 |
North America |
5.33 |
1.73 |
0.41 |
A |
|
|
Europe |
4.36 |
2.02 |
A |
|||
|
Korea |
4.39 |
2.03 |
A |
|||
|
B9 |
North America |
5.56 |
1.74 |
0.03(*) |
B |
|
|
Europe |
4.36 |
1.91 |
A |
|||
|
Korea |
3.72 |
1.99 |
A |
|||
|
Neat |
B1 |
North America |
5.11 |
1.90 |
0.42 |
A |
|
Europe |
5.50 |
1.61 |
A |
|||
|
Korea |
4.89 |
1.46 |
A |
|||
|
B2 |
North America |
5.22 |
1.72 |
0.17 |
A |
|
|
Europe |
5.29 |
1.82 |
A |
|||
|
Korea |
4.54 |
1.40 |
A |
|||
|
B3 |
North America |
4.78 |
1.79 |
0.40 |
A |
|
|
Europe |
3.86 |
1.96 |
A |
|||
|
Korea |
4.37 |
1.53 |
A |
|||
|
B4 |
North America |
6.11 |
1.17 |
0.03(*) |
B |
|
|
Europe |
5.21 |
2.01 |
A |
|||
|
Korea |
4.68 |
1.44 |
A |
|||
|
B5 |
North America |
9 |
5.11 |
0.43 |
A |
|
|
Europe |
14 |
4.93 |
A |
|||
|
Korea |
57 |
4.51 |
A |
|||
|
B6 |
North America |
3.89 |
1.36 |
0.94 |
A |
|
|
Europe |
3.64 |
1.98 |
A |
|||
|
Korea |
3.70 |
1.70 |
A |
|||
|
Neat |
B7 |
North America |
6.33 |
0.87 |
0.13 |
A |
|
Europe |
5.50 |
1.65 |
A |
|||
|
Korea |
5.35 |
1.30 |
A |
|||
|
B8 |
North America |
5.89 |
0.93 |
0.13 |
A |
|
|
Europe |
4.64 |
1.86 |
A |
|||
|
Korea |
5.04 |
1.38 |
A |
|||
|
B9 |
North America |
5.56 |
1.13 |
0.04(*) |
B |
|
|
Europe |
4.07 |
1.69 |
A |
|||
|
Korea |
4.40 |
1.57 |
A |
|||
|
Masculine |
B1 |
North America |
5.33 |
1.50 |
0.80 |
A |
|
Europe |
5.07 |
1.49 |
A |
|||
|
Korea |
5.26 |
0.86 |
A |
|||
|
B2 |
North America |
5.56 |
1.24 |
0.69 |
A |
|
|
Europe |
5.21 |
1.12 |
A |
|||
|
Korea |
5.25 |
0.99 |
A |
|||
|
B3 |
North America |
4.89 |
1.36 |
0.87 |
A |
|
|
Europe |
5.00 |
1.41 |
A |
|||
|
Korea |
4.81 |
1.22 |
A |
|||
|
B4 |
North America |
4.11 |
1.27 |
0.70 |
A |
|
|
Europe |
4.00 |
1.47 |
A |
|||
|
Korea |
4.30 |
1.19 |
A |
|||
|
B5 |
North America |
5.11 |
0.93 |
0.20 |
A |
|
|
Europe |
4.14 |
1.61 |
A |
|||
|
Korea |
4.46 |
1.20 |
A |
|||
|
B6 |
North America |
5.11 |
1.27 |
0.13 |
A |
|
|
Europe |
4.00 |
1.71 |
A |
|||
|
Korea |
4.54 |
1.17 |
A |
|||
|
B7 |
North America |
5.67 |
1.50 |
0.81 |
A |
|
|
Europe |
5.29 |
1.77 |
A |
|||
|
Korea |
5.44 |
1.23 |
A |
|||
|
B8 |
North America |
5.33 |
1.66 |
0.81 |
A |
|
|
Europe |
5.29 |
1.73 |
A |
|||
|
Korea |
5.51 |
1.10 |
A |
|||
|
Masculine |
B9 |
North America |
4.44 |
1.81 |
0.02(*) |
A |
|
Europe |
3.50 |
1.65 |
A |
|||
|
Korea |
4.75 |
1.35 |
A |
According to summarization of the colors with statistically significant differences in the ANOVA result by each representative affection, culture, and race factor as shown in Table 8, the difference of affection was bigger than those of culture and race on the red and green colors than the blue color, and a statistically significant difference was shown in one affection at least in most colors. According to a comparative analysis of the results in Table 8 and the color RGB locations in Table 4, when the green color value changes, the differences of culture and race showed a statistically significant trend in terms of "passionate" (affection 1). When the red color value changes, the differences of culture and race showed a statistically significant trend in terms of masculine (affection 3). Meanwhile, no clear trend was shown depending on the color value change in terms of neat (affection 2).
|
Color |
Aff.1 |
Aff.2 |
Aff.3 |
Color |
Aff.1 |
Aff.2 |
Aff.3 |
Color |
Aff.1 |
Aff.2 |
Aff.3 |
|
R1 |
○ |
○ |
|
G1 |
|
|
○ |
B1 |
|
|
|
|
R2 |
○ |
○ |
|
G2 |
○ |
|
○ |
B2 |
|
|
|
|
R3 |
○ |
○ |
○ |
G3 |
○ |
|
○ |
B3 |
|
|
|
|
R4 |
|
|
|
G4 |
○ |
|
|
B4 |
○ |
○ |
|
|
R5 |
|
○ |
|
G5 |
|
|
|
B5 |
○ |
|
|
|
R6 |
|
|
○ |
G6 |
○ |
○ |
|
B6 |
|
|
|
|
R7 |
○ |
|
|
G7 |
○ |
|
|
B7 |
|
|
|
|
R8 |
○ |
|
|
G8 |
○ |
|
○ |
B8 |
|
|
|
|
R9 |
|
○ |
○ |
G9 |
○ |
|
○ |
B9 |
○ |
○ |
○ |
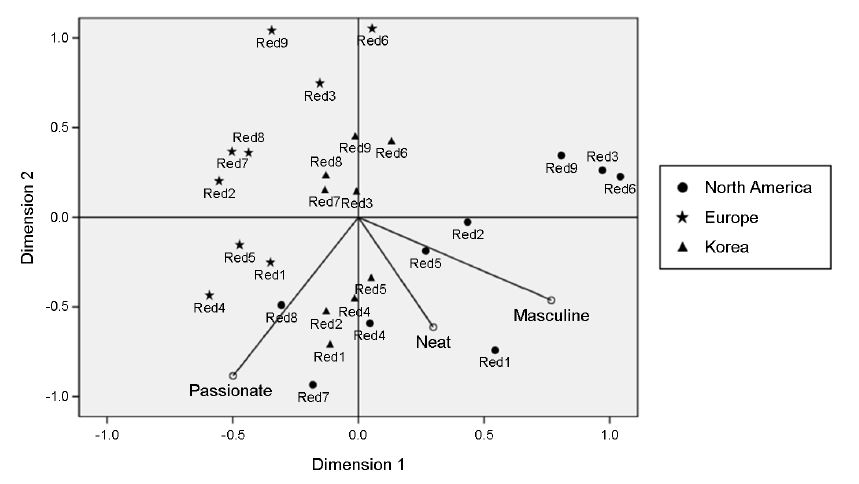
This study expressed the locations of the colors reflecting culture and race factors with representative affections, namely passionate, neat, and masculine using the multi-dimensional scaling (MDS). As a result, the red color was revealed as shown in Figure 2. The stress value indicating suitability level in MDS was within 0.05, and the expression result was suitable. Similar to the ANOVA post-hoc analysis result on colors, the colors were located distinguishingly from the representative affection aspect. Korea had some colors having similar affections with North America, but Korea was mostly located closer to Europe, rather than North America.
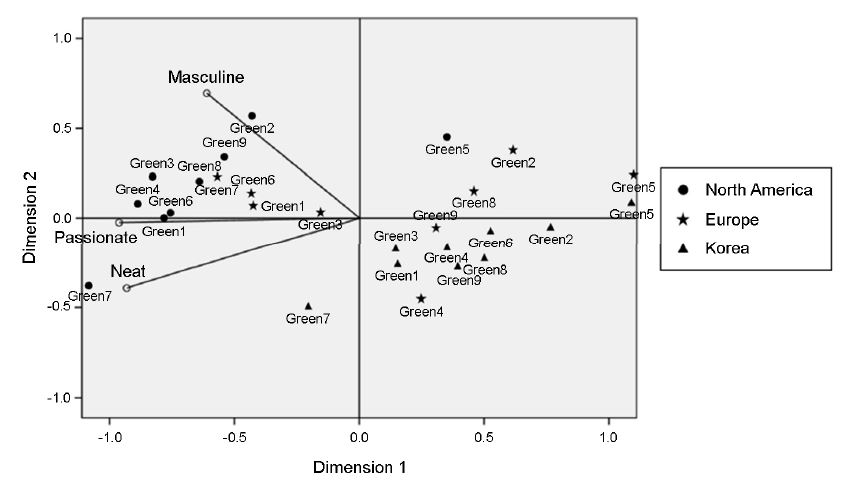
Figure 3 shows the expressed location result of the colors belonging to the green color group using MDS. The stress value indicating suitability level in MDS was within 0.05, and the expression result was suitable. As a result, representative affections' variation of the presented colors was not huge in North America, and an opposite trend in representative affections was shown in comparison with Korea. Meanwhile, Europe was located similarly with North America partially, and with Korea partially. However, Korea and Europe were located closer than North America and Europe like the red color group, and thus more similar trend was shown in terms of affection.
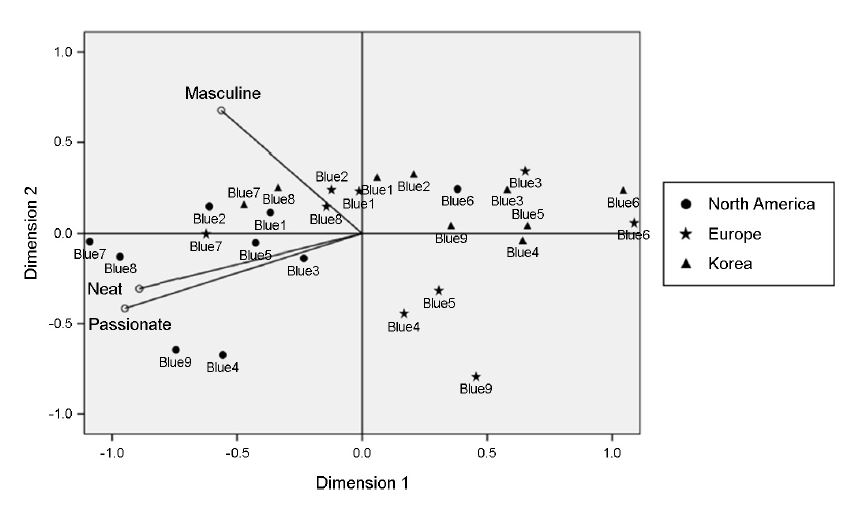
Lastly, Figure 4 shows the expressed location result of the colors belonging to the blue color group using MDS. The stress value indicating suitability level in MDS was within 0.05, and the expression result was suitable. As a result, North America showed an opposite trend in representative affections in comparison with Korea. Meanwhile, Europe was located similarly with North America partially, and also with Korea partially. However, Korea and Europe were located closer than North America and Europe, and thus a more similar trend was shown in terms of affection.
North America was an independent group in most colors, and showed an opposite trend in representative affections in comparison with Korea. Although Europe showed a more similar trend partially, most showed more similar trend as Korea, rather than North America. Therefore, Korea and Europe were classified as the homogeneous group. The variation of representative affections according to variation in the tone and chroma of colors was the biggest in Europe. From the color aspect, the green and blue colors showed less sensitive affection change than the red color.
This study deducted representative affections to measure the affections felt by looking at the colors on a visual display applied to a car, and confirmed cultural and racial differences by carrying out affection evaluation on colors through the deducted representative affections. The color-related representative affections on the visual display were deducted as passionate, neat, and masculine. Such a result can match in that intensity & clearness and gentleness & cleanness, which are the results of a study of Park (2008) as the combination of affective adjectives on colors by dividing them into objective adjectives and subjective adjectives, are connected with the results of this study, namely connected with passionate (intensity and clearness) and neat (gentleness and cleanness). However, there is a difference from the masculine aspect, which is the result of this study. Park (2008) classified adjectives into objective adjectives and subjective adjectives, and extracted representative affections depending on classification based on the adjectives concerned with the classification. This study, however, extracted representative affections by collecting the adjectives related with the colors on the visual display. The study of Park (2008) evaluated color itself in terms of evaluation subject; however, this study evaluated the colors expressed from a visual display. Although there were differences in representative affections, the affective adjectives belonging to each dimension were revealed commonly in comparison with the affective adjectives belonging to each dimension. Therefore, the study result of Park supports the result of this study.
Preference for color or affection is not an issue of colors such as red, blue, and yellow. The colors used in this study were based on the basic red, green, and blue colors constituting light and a visual display colors beyond simple light in reflection of variation by the complex attributes of color, brightness, and chroma. In this manner, this study constituted the evaluation colors by reflecting the variation of tone and chroma in each color group. The evaluation color levels were set up after evaluation on whether they can be discerned with the naked eye targeting 10 subjects. However, there can be a difficulty in perceiving, because sensitivity according to the variation can be felt relatively small according to subjects. Even though evaluation colors were constituted on the basis of the red, green, and blue colors, which are the basic colors constituting a visual display, more meaningful result can be presented from the utilization aspect in the industry, when differences of culture and race are seen by affection evaluation in reflection of variation in tone and chroma for the basic colors of the Munsell color order system additionally.
This study comparatively analyzed cultural and racial differences by classifying them into North American region, European region, and East Asian region. Consequently, North American region had affections on colors differentiated from the European and East Asian regions. The reason why affections on colors of East Asia were distinguished from those of North America and were more similar to those of Europe is that East Asian's culture was exposed to more to the culture and design of Europe. Thus, European culture and design empirically affected the perception of colors, which was revealed similarly in the affections on colors. Because personal color affection is continuously reinterpreted depending on the change of social, cultural, and environmental context (Whang and Kwon, 2005), it is valid to classify the subjects into culture and race for color evaluation. This study, however, just comparatively analyzed the differences of culture and race, but did not control the age or gender factor. If a study on colors is carried out in consideration of this, more accurate and useful data can be provided.
This study analyzed the differences of culture and race through evaluation on the basic color factors constituting the colors viewed on an automotive visual display, and therefore the results can be utilized for reflection of such differences in the color expression of the automotive visual display. However, the colors from a visual display are not expressed as one color in the whole screen of the visual display, and various colors co-exist, and there are the types of menu and information display. Therefore, consideration of a study on a single color or arrangement of colors of Kobayashi (1987, 1991), or a study on lines and pictures of Takahashi (1995) is needed. Existing studies, however, did not reflect color, brightness, and chroma in affection evaluation on colors, an additional study seems to be required with an approach on the representative affections on colors and color constitution deducted as the result of this study.
This study analyzed the difference of affections on the colors on an automotive visual display according to cultural and racial differences. This study actually built a cultural and racial affection system in a color group reflecting variation in tone and chroma in the representative color groups constituting the colors on an automotive visual display. To build an affection evaluation system on the colors on an automotive visual display, this study collected and evaluated the affective adjectives related with colors viewed on the automotive visual display. Such three dimensions as passionate, neat, and masculine were deducted as the affections related with colors viewed on the automotive visual display.
This study carried out affection evaluation on the colors on the automotive visual display by reflecting cultural and racial factors. To identify the differences by group, a variance analysis was conducted in this study. Consequently, a statistically significant difference was shown in one affection at least from most colors. When the homogenous group was confirmed through a post-hoc analysis, mainly Korea and Europe were classified as the homogeneous group, and North America was classified as a different group from Korea and Europe, rather than North American, European, and Korean groups were classified as mutually different groups. This study also indicated the locations of the colors presented as stimulus on the representative affections by each color group using MDS by reflecting cultural and racial differences. The similar result was shown from the comprehensive aspect of affections: North America was classified as a heterogeneous group from Korea, and Europe was located closer to Korea, and thus Europe was classified as the homogeneous group with Korea, rather than North America. Through this, North American affections on colors are judged to show differences from Korea, and Europe is conjectured to show similar affections as Korea, although Korea and Europe cannot be considered to be equal in affection.
As for color groups, the differences of culture and race were bigger in the affections on the red and green colors than on the blue color, and the variation of affection was the biggest in the red color. Whether the RGB locations used for color level and statistically significant differences were considered together, the differences of culture and race showed a statistically significant trend, when the green value changed at the passionate affection dimension. At the masculine affection dimension, the differences of culture and race showed a statistically significant trend, when the red value changed. Namely, "passionate" can have high correlations with the green color, and "masculine" with the red color at the affection dimension. In the sensitivity of colors, the sensitivity of the blue and green colors was lower than the red color in terms of sensitivity difference. Europe and Korea felt almost the same affections on the presented green color, except North America. In other words, the differences of culture and race need to be considered, when the red color is expressed on a visual display in terms of color expression.
Because the variation of tone and chroma on each color affects the affection differences to culture and race, there is a need to express the colors considering the culture and race to which representative users belong upon expressing colors by reflecting all those above. Through the MDS result, the color environment setting of a visual display can differ according to color coordination such as the menu, information display, or background of a car in consideration of affection on colors. In this regard, the color environment setting of a visual display can differ depending on market, and user satisfaction can be enhanced through the products taking into account user experience. With all this, competitiveness can be elevated in the market, where boundaries of countries and cultures are obscure.
References
1. Adams, M.F. and Osgood, E.C., A cross-cultural study of the affective meanings of color, Journal of Cross-Cultural Psychology, Vol. 4, No. 2, 1973.
Crossref
Google Scholar
2. Davies, R.L.I., and Corbett. G.G., A cross-cultural study of colour grouping: Evidence for weak linguistic relativity, British Journal of Psychology, 88, 493-517, 1997.
Crossref
Google Scholar
3. Derefeldt, G., Swartling, S., Berggrund, U. and Bodrogi, P., Cognitive Color, Color Research and Application, 29(1), 7-19, 2004.
Crossref
Google Scholar
4. Frost, M. and Sullivan, K., HMI for Vehicle Applications - Technology Roadmaps, OEM Strategies, Opportunities and Implications, 2006.
Crossref
5. Gao, X. and Xin, J.H., Investigation of human's emotional response on colors, Color Research and Application, 31(5), 411-417, 2006.
Crossref
Google Scholar
6. Jang, E.H., Choi, S.S., Lee, K.H. and Sohn, J.H., Development of Emotion Assessment Scale in Evaluation of Television Picture Quality, Journal of Korean Society for Emotion and Sensibility, Vol. 12, No. 1, 121-128, 2009.
Crossref
Google Scholar
7. Jee, S.D., Choi, K.J., Kim, H.K. and Lee, S.H., Sensibility Evaluation of Color Temperature and Rendering Index to the LED-Based White Illumination, Journal of Korean Society for Emotion and Sensibility, Vol. 9, No. 4, 353-366, 2006.
Crossref
Google Scholar
8. Jung, H.W. and Nah, K., A study on the Meaning of Sensibility and Vocabulary System for Sensibility Evaluation, Journal of the Ergonomics Society of Korea, Vol. 26, No. 3, 17-25, 2007.
Crossref
Google Scholar
9. Kang, K.T., Research in In-Vehicle Display Field, Ergonomics Society of Korea, 249-252, 2009.
Crossref
10. Kang, Y.C., Ryu, M.O. and Park, K.J., Enhancing Visual Perception Using color Processing of Mobile Display, The HCI Society of Korea, 697-702, 2008.
Crossref
Google Scholar
11. Kim, J.S. and Lee, S.I., The Effects of Color, Tones values on Image Perception of natural dyeing of han-san Mosi and cotton, Journal of the Korean Society of Clothing and Textiles, Vol. 29, No. 5, 662-670, 2005.
Crossref
Google Scholar
12. Kim, Y.W. and Choi, J.M., Color Sensibility and Preference of the Black Color Fabrics, Journal of Korean Society for Emotion and Sensibility, Vol. 13, No. 2, 337-346, 2010.
Crossref
Google Scholar
13. Kobayashi, S., A book of Colors, Kodansha, 1987.
Crossref
14. Kobayashi, S., Color Image Scale, Kodansha, 1991.
Crossref
15. Korea Institute of Design Promotion (KIDP), Color Marketing Survey Report for Brand Enhancement, Ministry of Commerce Industry and Energy, Korea, 2003.
Crossref
16. Korea Society of Color Studies, Colorist, Gukje, 2002.
Crossref
17. Lee, E.S. and Suk, H.J., The Emotional Response to Lighting Hue Focusing on Relaxation and Attention, Archives of Design Research, 25(2), 27-39, 2012.
Crossref
18. Lee, J.A., Color Design for Art Education, Knowledge and Sensibility, 2013.
Crossref
19. Lee, J.M., Color Communication: it's color, Illjinsa, 2016.
Crossref
20. Lee, K.H., Human Sensibility and Its Measurement and Evaluation, Journal of Korean Society for Emotion and Sensibility, 37-42, 1997.
Crossref
21. Lim, E.Y., Cho, K.J. and, Han, K.H., A study on Developing Sensibility Model for Visual Display, Korean Journal of Cognitive Science, 15(2), 1-15, 2004.
Crossref
22. Mahnke, F.H., Color, Environment, and Human Response, Van Nostrand Reinhold Company, 16-25, 1996.
Crossref
23. Norman, Emotional design: Why we love (or hate) everyday things, Basic Books, 2005.
Crossref
24. Osgood, E.C., Suci, G.J. and Tannenbaum, P.H., The Measurement of Meaning, Urbana: University of Illinois Press, 1957.
Crossref
25. Ou, L., Luo, M.R., Woodcock, A. and Wright, A., A study of colour emotion and colour preference. part Ⅰ: colour emotions for single colours, Color Research and Application, 29(3), 232-240, 2004.
Crossref
26. Park, C.H., A study on the Hierarchical Structure of Color Sensibility, Korean Journal of Cognitive Science, 19(1), 41-56, 2008.
Crossref
27. Park, H.R., Regional variations of general and apparel preference in color, Korean Society of Color Studies, 14(1), 29-35, 2000.
Crossref
28. Park, Y.S. and Song, S.A., The Research on Preference Colors and Color Image of the 20's, Korean Society of Color Studies, 28(3), 69-80, 2014.
Crossref
29. Song, J.G., A Morphological Study on Sensory Adjectives in Modern Korean, Seoul National University Library, 2007.
Crossref
30. Takahashi, S., Aesthetic properties of pictorial perception, Psychological Review, 102(4), 671-683, 1995.
Crossref
Google Scholar
PubMed
31. Valdez, P. and Mehrabian, A., Effects of color on emotions, Journal of Experimental Psychology, 123(4), 394-409, 1994.
Crossref
Google Scholar
PubMed
32. Whang, S.M. and Kwon, B.M., A study on Human Color Sensibility according to Psychological Color Image Scale (PCIS), Korean Society of Color Studies, 19(1), 13-25, 2005.
Crossref
33. Wright, B. and Rainwater, L., The meaning of color, Journal of Genetic Psychology, 67, 89-99, 1962.
Crossref
PubMed
34. Yi, E.J. and Choi, J.M., Color Sensibility Factors for Yellowish and Reddish Natural Dyed Fabrics by 40s Middle-Aged Consumers, Journal of Korean Society for Emotion and Sensibility, 12(1), 109-120, 2009.
Crossref
Google Scholar
PIDS App ServiceClick here!


