eISSN: 2093-8462 http://jesk.or.kr
Open Access, Peer-reviewed
eISSN: 2093-8462 http://jesk.or.kr
Open Access, Peer-reviewed
Jungmin Choi
, Jungwoo Park
, Hyunseung Kim
10.5143/JESK.2017.36.3.183 Epub 2017 June 24
Abstract
Objective: The purpose of this research was to assess the agreement between job physical risk factor analysis by ergonomists using ergonomic methods and physical examinations made by occupational physicians on the presence of musculoskeletal disorders of the upper extremities.
Background: Ergonomics is the systematic application of principles concerned with the design of devices and working conditions for enhancing human capabilities and optimizing working and living conditions. Proper ergonomic design is necessary to prevent injuries and physical and emotional stress. The major types of ergonomic injuries and incidents are cumulative trauma disorders (CTDs), acute strains, sprains, and system failures. Minimization of use of excessive force and awkward postures can help to prevent such injuries
Method: Initial data were collected as part of a larger study by the University of Utah Ergonomics and Safety program field data collection teams and medical data collection teams from the Rocky Mountain Center for Occupational and Environmental Health (RMCOEH). Subjects included 173 male and female workers, 83 at Beehive Clothing (a clothing plant), 74 at Autoliv (a plant making air bags for vehicles), and 16 at Deseret Meat (a meat-processing plant). Posture and effort levels were analyzed using a software program developed at the University of Utah (Utah Ergonomic Analysis Tool). The Ergonomic Epicondylitis Model (EEM) was developed to assess the risk of epicondylitis from observable job physical factors. The model considers five job risk factors: (1) intensity of exertion, (2) forearm rotation, (3) wrist posture, (4) elbow compression, and (5) speed of work. Qualitative ratings of these physical factors were determined during video analysis. Personal variables were also investigated to study their relationship with epicondylitis. Logistic regression models were used to determine the association between risk factors and symptoms of epicondyle pain.
Results: Results of this study indicate that gender, smoking status, and BMI do have an effect on the risk of epicondylitis but there is not a statistically significant relationship between EEM and epicondylitis.
Conclusion: This research studied the relationship between an Ergonomic Epicondylitis Model (EEM) and the occurrence of epicondylitis. The model was not predictive for epicondylitis. However, it is clear that epicondylitis was associated with some individual risk factors such as smoking status, gender, and BMI. Based on the results, future research may discover risk factors that seem to increase the risk of epicondylitis.
Application: Although this research used a combination of questionnaire, ergonomic job analysis, and medical job analysis to specifically verify risk factors related to epicondylitis, there are limitations. This research did not have a very large sample size because only 173 subjects were available for this study. Also, it was conducted in only 3 facilities, a plant making air bags for vehicles, a meat-processing plant, and a clothing plant in Utah. If working conditions in other kinds of facilities are considered, results may improve. Therefore, future research should perform analysis with additional subjects in different kinds of facilities. Repetition and duration of a task were not considered as risk factors in this research. These two factors could be associated with epicondylitis so it could be important to include these factors in future research. Psychosocial data and workplace conditions (e.g., low temperature) were also noted during data collection, and could be used to further study the prevalence of epicondylitis. Univariate analysis methods could be used for each variable of EEM. This research was performed using multivariate analysis. Therefore, it was difficult to recognize the different effect of each variable. Basically, the difference between univariate and multivariate analysis is that univariate analysis deals with one predictor variable at a time, whereas multivariate analysis deals with multiple predictor variables combined in a predetermined manner. The univariate analysis could show how each variable is associated with epicondyle pain. This may allow more appropriate weighting factors to be determined and therefore improve the performance of the EEM.
Keywords
Epicondylitis Tennis elbow Golf elbow Ergonomics
Ergonomics is the systematic application of principles concerned with the design of devices and working conditions for enhancing human capabilities and optimizing working and living conditions. Proper ergonomic design is necessary to prevent injuries and physical and emotional stress. The major types of ergonomic injuries and incidents are cumulative trauma disorders (CTDs), acute strains, sprains, and system failures. A number of studies have investigated epicondylitis among industrial workers. Descatha et al. studied links between personal and occupational factors and medial/lateral epicondylitis. Prevalence of medial epicondylitis was strongly associated with forceful work and other upper-limb work-related musculoskeletal disorders (WMSDs) (e.g., carpal tunnel syndrome, shoulder tendinitis, or ulnar nerve entrapment at the elbow). Prevalence of lateral epicondylitis was associated with age, repetitive pressing with a hand, and psychosomatic problems (Descatha et al., 2003).
Construction tasks are strongly related to epicondylitis. "Construction work is characterized by manual handling, high hand forces, and repetitive motions combined with awkward postures" (Silverstein et al., 2002). It dominates the worker's compensation claim incidence rates for shoulder and elbow disorders (Silverstein et al., 2002; Silverstein et al., 1998). Viikari-Juntura et al. (1991) found that "Workers in strenuous jobs reported elbow problems 1.7 (1.6~1.8 OR, 95% CI) times more often than those in non-strenuous jobs" (p. 38). They also concluded that high force and high repetition jobs contribute to epicondylitis disorders.
Based on the epidemiologic studies reviewed above, NIOSH concluded that there was evidence for a relationship between forceful work and epicondylitis, and strong evidence for an association between exposures to a combination of risk factors (e.g., force and repetition, force and posture) and epicondylitis. However, insufficient evidence was found for support associations between epicondylitis and repetitive work alone or postural factors alone (Bernard, 1997). There are significantly fewer epidemiologic studies about work-related risk factors for elbow MSDs than for other MSDs. Most of these studies compare the prevalence of epicondylitis in workers in highly repetitive, forceful jobs to workers in less repetitive, forceful jobs. Therefore, it is necessary to investigate the risk factors associated with epicondylitis to know what changes can be made to reduce the risk of injuries.
The purpose of this research was to assess the agreement between job physical risk factor analysis by ergonomists using ergonomic methods and physical examinations made by occupational physicians on the presence of musculoskeletal disorders of the upper extremities. Posture and effort levels were assessed by multiple analysts while watching representative cycles of videotaped jobs using a custom software program developed at the University of Utah (Utah Ergonomic Analysis Tool). Efforts and postures were used to build a risk assessment model to predict the presence of epicondylitis. Prevalence data were used to determine the association between the model outcome and physical examination data related to epicondylitis.
The workplace parameters investigated were perceived ratings of intensity of exertion (Borg CR-10 scale), forearm rotation (pronation/supination), wrist posture (extension/flexion), elbow compression, and speed of work. The personal parameters investigated were age, gender, diabetes, handedness, smoking status, and BMI. The workplace and personal parameters were compared to the medical results of the workers to determine if epicondylitis may be associated with job tasks performed. In addition to describing the associations of job physical factors to epicondylitis, a byproduct of this research was a model to evaluate potential risk factors that can be used to prevent future cases of work related epicondylitis.
RULA, Rodgers's model, and Strain Index were all intended to measure risk to the DUE. However, none focus on the elbow exclusively. The purpose of this study is to meet the need for an analysis method targeting elbow disorders, specifically epicondylitis. The model used here targets the elbow and is conceptually most similar to the Strain Index.
The data used in this research were collected by the University of Utah Ergonomics and Safety program field data collection teams and medical data collection teams from the Rocky Mountain Center for Occupational and Environmental Health (RMCOEH). Three manufacturing plants in Utah were selected to collect information for this study: Autoliv (a plant making air bags for vehicles), Deseret Meat (a meat-processing plant), and Beehive Clothing (a clothing plant). The study collected data for 173 persons performing 425 jobs using structured questionnaires, data collection forms, and video tapes. Data were collected for every job rotation of each worker enrolled in the study. Job analyses were performed to collect information about force requirements, posture, speed of work, and duration of exposure. Focus was placed on upper extremity motion, with special emphasis on the distal upper extremity (DUE). Medical evaluations were conducted on employees to verify symptoms of epicondylitis by qualified occupational physicians. The medical outcomes were used to compare the findings from medical exams relating to employee symptoms with job hazard data collected by the ergonomic data collection teams.
The subjects included in this study were both male and female employees from a variety of socioeconomic statuses and ethnicities. There were 83 subjects at Beehive Clothing, 74 at Autoliv, and 16 at Deseret Meat for a total 173 subjects. The average subject height was 65.1 inches (165.3cm) and ranged from 56 to 75.9 inches (142 to 192.9cm). Subject weights ranged from 86.9 to 340.6 pounds (39.4 to 154.5kg) with a mean weight of 187.6 pounds (85.1kg). The average Body Mass Index (BMI) was 31.1kg/m2 and ranged from 16.2 to 52.8kg/m2. The average age was 42 years and ranged from 21 to 63 years. Female employees accounted for 129 subjects (74.6%) and smokers represented only 17 subjects (9.8%). One hundred and forty nine subjects (86.1%) were right-handed. Left-handed and both-handed (ambidextrous) subjects each accounted for 12 subjects (6.9%). There were 15 subjects with diabetes (8.7%).
In order to perform the ergonomic job evaluation, the workers were video-taped while performing their jobs. Video recordings are commonly used in task analysis. Permission was obtained from the subject and their employer and cameras captured a full view of each subject's posture. All videos were recorded in digital format to improve analysis capability using a computer program. A number of postures were recorded. These included wrist flexion/extension, ulnar/radial deviation, supination/pronation, and elbow angle. Infrequently, irregular work frames occurred. These were not captured or analyzed during the video sampling session. The ergonomists had to rely on an interview to gather information about these rare but potentially stressful tasks that were not observed. Every effort was made to select representative job cycles for analysis in this study.
Ergonomic analyses of the videotaped job tasks were then performed using software that was developed specifically for ergonomic analysis of the distal upper extremities (DUE). The UEA tool was well suited for both time and task-based analysis and has demonstrated significant usability and repeatability (Adams, 2009; Rodriguez, 2006). The videos were analyzed frame by frame to evaluate subject postures and estimate forces. The software allowed for frame-by-frame advancement and preview/review at both accelerated and slowed rates to facilitate view and review specific events of interest. The UEA tool also enables the user to capture individual frames for inclusion in reports or for additional analyses. Frame-by-frame video analysis allowed assessment of the location of the subject and equipment, and the subject's actions and movements. The program consists of a custom graphical user interface (GUI) with menus for each posture category to allow the user to choose the closest posture to that which was observed in the video.
Members of the ergonomics team visited each participating plant at the beginning of the study (baseline) to obtain detailed data for quantification of work-related physical factors. Participating plants include Autoliv (a plant making air bags for vehicles), Deseret Meat (a meat-processing plant), and Beehive Clothing (a clothing plant). The ergonomists were all graduate students and had education in ergonomic science. In addition, a training class was provided prior to visits. Each subject was enrolled in the study by the health evaluation team. Subjects continued working their jobs during ergonomic data collection. Forces were assessed using subjective measures. Ratings of perceived exertion (RPE) provide an integrated response of the body to physical stresses. It was assessed as peak and average ratings for distal upper extremities (DUE) using the Borg CR-10 scale. Repetition (number of exertions per cycle), Frequency (number of exertions per minute), and Duration of exertion were computed from video tapes. Elbow flexion, Pronation/Supination, Wrist flexion/extension, Wrist ulnar/radial deviation, and Type of grip were assessed for both left and right sides. They were measured by observing video; particular attention was given to elbow flexion angles < 70 and > 135. Forearm posture was considered to have deviated from neutral when rotation of the forearm exceeded 45 either in pronation or supination. The type of grip included Power grip, Hook grip, Oblique grip, Palmer grip, Palmer pinch, 2- or 3-point pinch, and Lateral (key) pinch.
Interviews with workers and employers are widely and successfully used to gather information in many ergonomics studies. The skill of interviewers is important. Some key points for interviewers include "1) knowing the possible biasing that can occur in the discussions; 2) reading interviewee's body language; 3) making adjustments depending on how the interviewee is reacting to the situation; 4) reaching across cultural and age gaps; 5) appropriate use of recording devices". A symptom survey interview was performed on subjects performing jobs (Lehto and Buck, 2007). The interview was conducted in a private location of each plant. Interviewers consisted of medical doctors and ergonomists. A body diagram was provided to help understand the body parts. The interviewers asked questions regarding the intensity, frequency, duration, and severity of pain, and symptoms at elbow, wrist, and hand. It also included interview questions regarding current and previous symptoms, absence from work, and medical history related to epicondylitis. A medical exam was performed on subjects by a medical team. The medical team consisted of occupational medicine physicians. The RMCOEH provided the medical data for this study. The medical team evaluated subject's basic physical and medical condition, including such factors as pulse rate and blood pressure. They asked questions regarding tenderness and physical abnormalities at elbow, wrist, and hand. There were also questions regarding prior and current MSDs. The medical exam provided more epidemiologic evidence of epicondylitis beyond that reported on the interview.
Videos from the three study plants were recorded and filed according to subject and job ID. Personal data such as age and work history were recorded for each subject using Position and Worker Specific Data Forms. The position form describes all jobs that a subject must perform for their position. The "position" represents a summary of all major work-related activities related to a subject's employment at a given time. Positions are composed of one or more jobs. Jobs describe the specific tasks through which a worker rotates throughout the work day. Each video was analyzed using the UAE tool and the outcomes were transferred to a spreadsheet. Health outcome data were prepared by physicians to be compared with the results of this research. The health and ergonomics teams were blinded to each other's data.
Ratings of perceived exertion (RPE) were determined for each task. The forearm rotation with various wrist postures was measured. The speed of work and elbow compression was also considered. The task-related variables were Intensity of exertion, Percent of cycle in pronation, Percent of cycle in supination, Percent of cycle in extension, Percent of cycle in flexion, Intensity of elbow compression, and Speed of work. The personal variables were Age, Gender, Smoking status, Diabetes, BMI, and Handedness.
The Ergonomic Epicondylitis Model (EEM) was developed as a means to assess the risk of epicondylitis from measurable job physical factors. The model used a rating for level of perceived exertion that was subjectively developed by analysts and is similar to the Borg scale and the Strain Index. The model considers five job risk factors by assigning them to categories: (1) intensity of exertion, (2) forearm rotation, (3) wrist posture, (4) elbow compression, and (5) speed of work. The qualitative ratings were determined by observing workers performing the task and selecting the rating during video analysis.
The score of the model is calculated by looking up the multiplier in Table 2 according to the rating described in the Table 1. The product of multipliers for each of five criteria is computed for a final score using Equation: EEM Score = IEM x FRM x WPM x ECM x SWM / Duration rate EEM Scores are computed for all observations. Scores are aggregated across jobs to produce both an average EEM and a peak (highest score) EEM. Job level EEM aggregate scores are then summed to compute position level EEMs. This produces a weighted average EEM and a global peak EEM.
|
Risk factors |
Intensity of |
Forearm |
Wrist |
Elbow |
Speed of |
|
1 |
Nothing at all |
Neutral |
0~30 |
No/negligible |
Very slow |
|
2 |
Very, very light |
Pronation/supination |
30~50 |
Moderate |
Slow |
|
3 |
Very light |
|
>50 |
Severe |
Fair |
|
4 |
Light |
|
|
|
Fast |
|
5 |
Moderate |
|
|
|
Very fast |
|
6 |
Somewhat hard |
|
|
|
|
|
7 |
Hard |
|
|
|
|
|
8 |
Very hard + |
|
|
|
|
|
Risk factors |
Intensity of |
Forearm |
Wrist |
Elbow |
Speed of |
|
1 |
0 |
1 |
1 |
1 |
1 |
|
2 |
1 |
3 |
2 |
1.5 |
1 |
|
3 |
2 |
|
3 |
2 |
1 |
|
4 |
3 |
|
|
|
1.5 |
|
5 |
4 |
|
|
|
2 |
|
6 |
5 |
|
|
|
|
|
7 |
6 |
|
|
|
|
|
8 |
7 |
|
|
|
|
Subjects with high EEM scores were considered to be at a greater risk for reporting epicondyle pain. Subjects with lower EEM scores were considered to be at a reduced risk for epicondyle pain.
The medical team tested each subject's pain with a standardized 4 kilograms of pressure at various locations of the elbow. Both lateral and medial aspects of subject's elbows were palpated with 4 kilograms of pressure. If a subject said it was anything other than painful, e.g., "tender" or "I could feel it", they were asked specifically, "Was that painful?" yes or no. There were six tender points related to lateral epicondylitis and two tender points related to medial epicondylitis. Lateral Epicondylitis Tender Point 6 was not used for data analysis because approximately half of the subjects reported pain at the point. These tender points are described in Table 3.
|
Lateral epicondylitis tender
point 1 |
Retro lateral epicondyle |
|
Lateral epicondylitis tender
point 2 |
Lateral epicondyle |
|
Lateral epicondylitis tender
point 3 |
Between lateral epicondyle
and radial head |
|
Lateral epicondylitis tender
point 4 |
Radial head |
|
Lateral epicondylitis tender
point 5 |
1cm distal to the radial head |
|
Lateral epicondylitis tender
point 6 |
Radial tunnel |
|
Medial epicondylitis tender
point 1 |
Medial epicondyle |
|
Medial epicondylitis tender
point 2 |
1cm distal to the medial epicondyle |
Results were evaluated for the following medical outcomes: lateral epicondyle pain (pain at one or more lateral locations, 1~5), medial epicondyle pain (pain at medial locations 1 or 2), and general epicondyle pain (pain at any epicondyle test locations, lateral 1~5 and medial 1 or 2).
3.1 Logistic regression analysis: Lateral epicondylitis for left side
Logistic regression analysis was performed for all variables with the medical outcome. Smoking status, gender, and BMI were significant for left side lateral epicondylitis. Smoking status had an odds ratio of 4.49 with a 95% confidence interval of 1.40 to 14.42. Gender had an odds ratio of 3.20 with a 95% confidence interval of 1.20 to 8.50. BMI was significant at the 10% significance level and had an odds ratio of 7.9. However, EEM, age, diabetes, and handedness were not statistically significant. In this logistic regression, BMI2 and BMI3 were made and used as variables because it is expected that BMI had a nonlinear effect. In other words, BMI may have something other than a linear effect since low BMI subjects develop epicondylitis as well as those with high BMIs. The logistic regression model is represented as follows:
Where p indicates the probability that a subject has pain in epicondyle, in this case, p=1 if the subject has pain in epicondyle and p=0 if the subject does not have pain in epicondyle. The summary of lateral epicondylitis for left side is described in Table 4.
|
|
p-value |
Regression coefficient |
Odds ratio |
95% CI for OR |
|
Smoking status |
0.012 |
1.502 |
4.489 |
1.398~14.417 |
|
Gender |
0.020 |
1.163 |
3.200 |
1.205~8.499 |
|
BMI |
0.063 |
2.073 |
7.949 |
0.894~70.700 |
|
BMI2 |
0.042 |
-0.071 |
0.932 |
0.871~0.997 |
|
BMI3 |
0.030 |
0.0007 |
1.000 |
1.000~1.001 |
|
Intercept |
0.067 |
-21.278 |
- |
- |
3.2 Logistic regression analysis: Lateral epicondylitis for right side
Logistic regression models were built for each variable. The model shows that a subject who has diabetes is less likely to have epicondylitis. This is an unexpected finding and may be due to relatively small sample size (only one subject in the dataset who had diabetes also had epicondylitis). Gender was significant at the 10% significance level. The other variables (EEM, age, BMI, smoking status, and handedness) were not statistically significant. The model was not predictive for the case definition tested. When diabetes was removed from the model, it allowed BMI to be significant at the 10% level. Gender was significant, but the other variables (EEM, age, diabetes, smoking status, and handedness) were not significant in the second model. The equation for the right side lateral epicondylitis model is as follows:
The summary of lateral epicondylitis for right side is described in Table 5 and 6.
|
|
p-value |
Regression coefficient |
Odds ratio |
95% CI for OR |
|
Gender |
0.051 |
0.794 |
2.212 |
0.995~4.915 |
|
Diabetes |
0.037 |
-2.196 |
0.111 |
0.014~0.874 |
|
Intercept |
0.001 |
-1.198 |
- |
- |
|
|
p-value |
Regression coefficient |
Odds ratio |
95% CI for OR |
|
Gender |
0.048 |
0.821 |
2.273 |
1.007~5.130 |
|
BMI |
0.101 |
1.504 |
4.500 |
0.744~27.207 |
|
BMI2 |
0.090 |
0.0473 |
0.954 |
0.903~1.007 |
|
BMI3 |
0.090 |
0.0004 |
1.000 |
0.100~1.001 |
|
Intercept |
0.097 |
-16.222 |
- |
- |
3.3 Logistic regression analysis: Medial epicondylitis for left side
Gender and BMI were significant for left side medial epicondylitis. Gender was significant at 10% confidence level and had an odds ratio of 2.13. BMI was highly significant with a p-value of 0.005. However, EEM, age, diabetes, smoking status, and handedness were not statistically significant. The model is represented as follows:
The summary of medial epicondylitis for left side is described in Table 7.
|
|
p-value |
Regression coefficient |
Odds ratio |
95% CI for OR |
|
Gender |
0.092 |
0.760 |
2.139 |
0.882~5.186 |
|
BMI |
0.005 |
1.260 |
34.064 |
2.885~402.258 |
|
BMI2 |
0.005 |
-0.104 |
0.901 |
0.837~0.969 |
|
BMI3 |
0.006 |
0.0009 |
1.000 |
1.000~1.002 |
|
Intercept |
0.004 |
-39.542 |
- |
- |
3.4 Logistic regression analysis: Medial epicondylitis for right side
Only BMI was significant at 10% confidence level. The other variables (EEM, gender, age, diabetes, smoking status and handedness) were not significant for right side medial epicondylitis. The equation for the second model is as follows:
The summary of medial epicondylitis for right side is described in Table 8.
|
|
p-value |
Regression coefficient |
Odds ratio |
95% CI for OR |
|
BMI |
0.058 |
2.062 |
7.861 |
0.931~66.347 |
|
BMI2 |
0.061 |
-0.061 |
0.941 |
0.882~1.003 |
|
BMI3 |
0.069 |
0.0005 |
1.0006 |
0.100~1.001 |
|
Intercept |
0.050 |
-23.046 |
- |
- |
3.5 Logistic regression analysis: Lateral and medial epicondylitis for left side
Lateral and medial epicondyle pain data were combined to study the relationship between risk factors and either epicondylitis. Seven tender points, five tender points related to lateral epicondylitis and two tender points related to medial epicondylitis, were used as dependent variables for logistic regression. Gender was significant and had an odds ratio of 3.2 with a 95% confidence interval of 1.21 to 8.5. Smoking status was significant and had an odds ratio of 4.49 with a 95% confidence interval of 1.4 to 14.42. BMI was significant at 10% confidence level. However, EEM, age, diabetes, and handedness were not statistically significant. The model is represented as follows:
The summary of lateral and medial epicondylitis for left side is described in Table 9.
|
|
p-value |
Regression coefficient |
Odds ratio |
95% CI for OR |
|
Gender |
0.020 |
1.163 |
3.200 |
1.205~8.499 |
|
BMI |
0.063 |
2.073 |
7.949 |
0.894~70.700 |
|
BMI2 |
0.042 |
-0.071 |
0.932 |
0.871~0.997 |
|
BMI3 |
0.030 |
0.0008 |
1.0008 |
1.000~1.001 |
|
Smoking status |
0.012 |
1.502 |
4.489 |
1.398~14.417 |
|
Intercept |
0.004 |
-21.278 |
- |
- |
3.6 Logistic regression analysis: Lateral and medial epicondylitis for right side
Gender was significant and had odds ratio of 2.27. BMI was significant at 10% confidence level. However, EEM, age, diabetes, smoking status and handedness were not statistically significant. The model is represented as follows:
The summary of lateral and medial epicondylitis for right side is described in Table 10.
|
|
p-value |
Regression coefficient |
Odds ratio |
95% CI for OR |
|
Gender |
0.048 |
0.821 |
2.273 |
1.007~5.130 |
|
BMI |
0.101 |
1.504 |
4.500 |
0.744~27.207 |
|
BMI2 |
0.090 |
-0.047 |
0.954 |
0.903~1.007 |
|
BMI3 |
0.090 |
0.0004 |
1.0005 |
1.000~1.001 |
|
Intercept |
0.097 |
-16.222 |
- |
- |
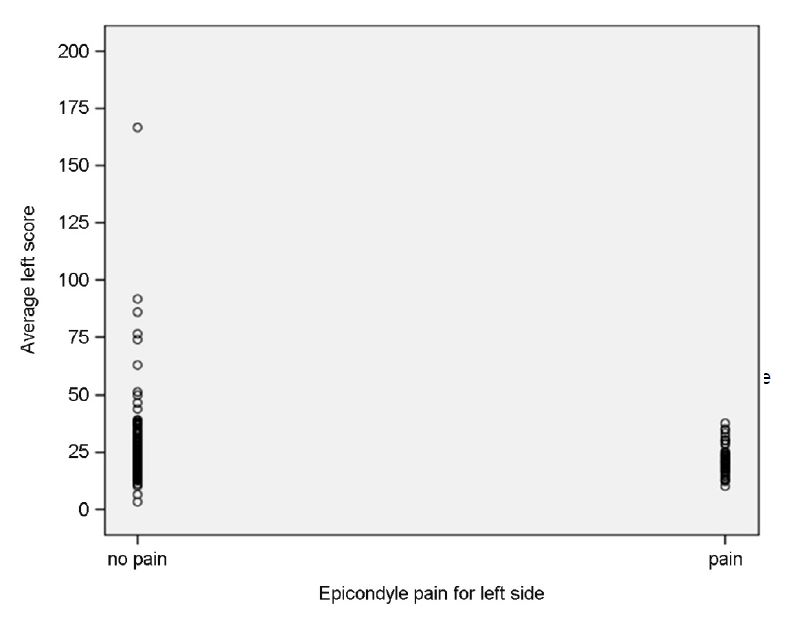
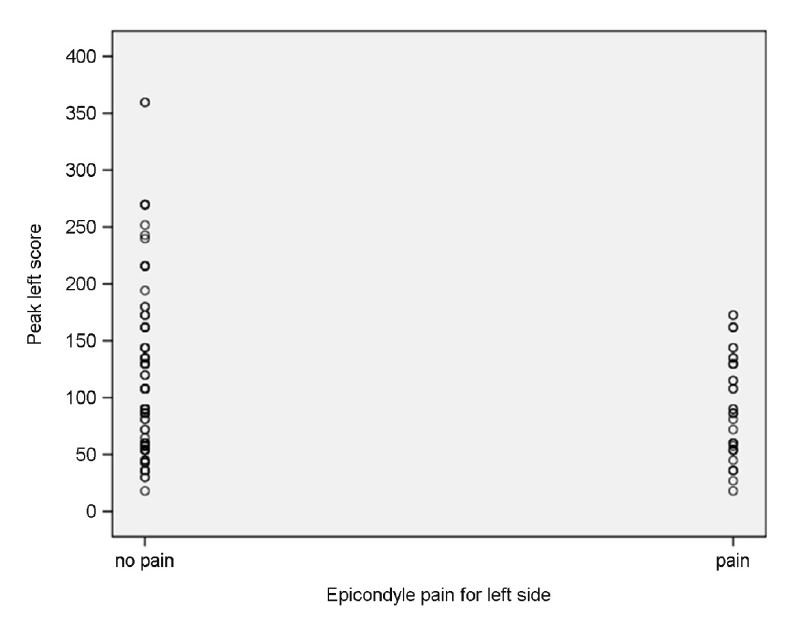
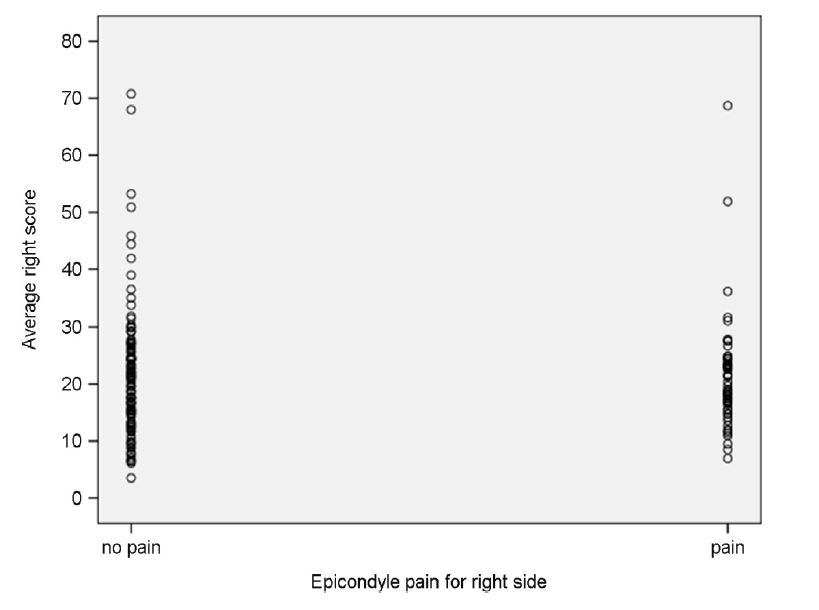
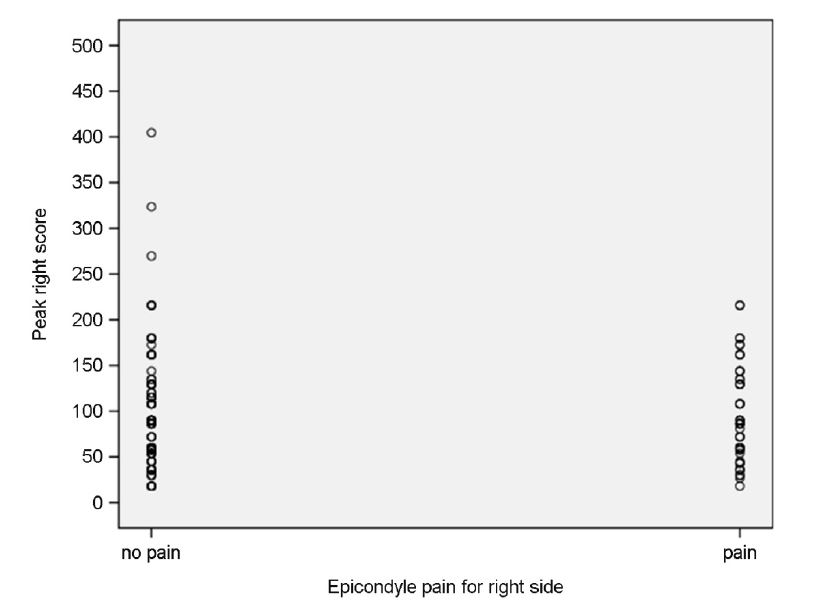
3.7 Relationship between EEM and epicondyle pain
A comparison of EEM scores by Epicondyle pain is presented in Figures 1 through 4. For average left score, scores were higher for subjects with no epicondyle pain (mean 27.3) than for subjects with epicondyle pain (mean 22.0). The other scores (peak left score, average right score, and peak right score) had small differences between subjects with and without epicondyle pain. There were no statistically significant differences in EEM scores for subjects who reported epicondyle pain when compared to subjects who did not report pain. An association between EEM scores and epicondyle pain could not be demonstrated.
In the current study, the focus was to build a multifactor model with the job variables as much as practically feasible. The model proposed here, EEM, failed to demonstrate predictive ability cross-sectionally for baseline discomfort data. Five job variables, intensity of exertion, forearm rotation, wrist posture, elbow compression, and speed of work, were included as risk factors in the model. Initially, various levels of motion were recorded and later these job variables were analyzed in the laboratory. Each subject was evaluated separately and the ergonomics team was blinded to medical outcomes while analyzing ergonomic data. Personal risk factors, age, gender, smoking status, diabetes, BMI, and handedness, were also investigated.
In the present study, only personal characteristics were found to be associated with epicondyle pain. BMI, smoking status, and gender were found to be statistically significantly associated with epicondyle pain. The present physical risk factor model, EEM, was a highly simplified combination of physical factors that have been previously associated with elbow disorders in other studies. Although it is disappointing that this model was not found to be associated with epicondylitis (pain at baseline), there are several possible explanations and an EEM-like model may still have some predictive capability. First, this study was cross-sectional in nature and not prospective. Although not available during this study, prospective data on the subjects studied here will be available for comparison with EEM outputs in the future. Second, sample sizes were relatively small and additional subject data will also be available in the future. Since EEM has already been programmed into the ergonomic database, rerunning the existing EEM to compare a greater number of subjects to prospective outcomes data will be relatively easy. Third, the EEM may have "over-averaged" physical risk factor data, thereby losing information on relative peaks in EEM intensity. For example, two jobs may have the same EEM average, but have very dissimilar EEM score patterns, one job may have relatively high EEM peaks followed by extended idle times (zero EEM score), whereas another job may have modest EEM scores throughout the work cycle, but an identical average EEM score. The possible effects of EEM score variations were not explained in this research. Fourth, more importantly, the EEM may have correct variables, but the combination or weight on the variables may not be optimal. The multipliers for each variable that were created based on the previous studies could be reconsidered and with different weighting factors may make the EEM significant. Fifth, according to the data analysis by plants, the plant with the highest EEM scores (Deseret Meat) had the lowest prevalence of epicondyle pain. This plant was all male. The plant with the lowest EEM score (Beehive Clothing) had relatively high prevalence of epicondyle pain. The plant was 97.6% female. Gender was strongly associated with epicondyle pain and may be confounding the EEM to some extent.
In this research, subjects with high ergonomic epicondylitis model (EEM) scores were no more likely to get symptoms of epicondylitis (epicondyle pain) than subjects with low scores. This indicates that there was not a significant association between risk factors (intensity of exertion, forearm and wrist posture, elbow compression, speed of work) as combined to form the EEM and epicondylitis. By comparing ergonomic and medical data, the effect of gender, smoking status, and BMI is noted. As shown by the p-values and odds ratios generated from the data, gender, smoking status, and BMI contributed to the regression model for epicondylitis and were, as demonstrated in previous research, found to be associated with epicondyle pain.
Although this research used a combination of questionnaire, ergonomic job analysis, and medical job analysis to specifically verify risk factors related to epicondylitis, there are limitations. This research did not have a very large sample size because only 173 subjects were available for this study. Also, it was conducted in only 3 facilities, a plant making air bags for vehicles, a meat-processing plant, and a clothing plant in Utah. If working conditions in other kinds of facilities are considered, results may improve. Therefore, future research should perform analysis with additional subjects in different kinds of facilities. These data will become available soon and a prospective study will be repeated using the EEM. Repetition and duration of a task were not considered as risk factors in this research. These two factors could be associated with epicondylitis so it could be important to include these factors in future research. Psychosocial data and workplace conditions (e.g., low temperature) were also noted during data collection, and could be used to further study the prevalence of epicondylitis.
As previously stated, future research will repeat this study using longitudinal analysis. This research was conducted using a cross-sectional data set that included a sample of individuals, taken at a given point in time providing the associative relationship between different variables. The fundamental difference between cross-sectional and longitudinal analysis comes from the structure of the data set. Whereas cross-sectional data takes place at a single point in time, longitudinal data consists of a time series, which consists of observations on a variable or several variables overtime, and seeks to relate independent variables with incident, rather than prevalence data. During this research, it was impossible to distinguish whether the exposure preceded or followed epicondylitis because exposure and epicondylitis status were measured at the same time. The longitudinal analysis will be used in future research, and it can show how variables affect each other at the same time and period. Univariate analysis methods could be used for each variable of EEM. This research was performed using multivariate analysis. Therefore, it was difficult to recognize the different effect of each variable. Basically, the difference between univariate and multivariate analysis is that univariate analysis deals with one predictor variable at a time, whereas multivariate analysis deals with multiple predictor variables combined in a predetermined manner. The univariate analysis could show how each variable is associated with epicondyle pain. This may allow more appropriate weighting factors to be determined and therefore improve the performance of the EEM.
In conclusion, this research studied the relationship between an Ergonomic Epicondylitis Model (EEM) and the occurrence of epicondylitis. The model was not predictive for epicondylitis. However, it is clear that epicondylitis was associated with some individual risk factors such as smoking status, gender, and BMI. Based on the results, future research may discover risk factors that seem to increase the risk of epicondylitis. This study has helped to improve the understanding of the epicondylitis problems encountered by industrial workers as well as add awareness about possible pathways to the development and prevention of MSDs. Plans are under way for a prospective analysis using a modified EEM that categorizes and quantifies the contributions of EEM scores in various magnitude ranges. This may help address the effects of relatively high EEM scores to overall risk. For example, it is possible that low EEM scores, like moderate exercise, are protective whereas high scores, which may exceed a worker's capabilities, are potentially injurious. By recording the categories of individual EEM scores, it may be possible through multiple logistic regressions to build a model based on physical risk factors that is predictive of elbow disorders. Such a model would be useful to ergonomists in designing jobs to minimize the likelihood of elbow disorders with work-related contributions.
References
1. Adams, B.K., Inter-rater reliability of the Utah Ergo Analyzer, Masters thesis, University of Utah, 2009.
Crossref
2. Bernard, B.P., Musculoskeletal Disorders and Workplace Factors, Cincinatti: NIOSH, 1997.
Crossref
Google Scholar
3. Descatha, A., Leclerc, A., Chastang, J.F. and Roquelaure, Y., Medial epicondylitis in occupational settings: Prevalence, incidence and associated risk factors, Journal of Occupational and Environmental Medicine, 45(9), 993-1001, 2003.
Crossref
Google Scholar
4. Lehto, M.R. and Buck, J.R., Introduction to human factors and ergonomics for engineers, New York: CRC Press, 2007.
Crossref
Google Scholar
5. Rodriguez, J.C., Efficacy of the Utah Ergo Analyzer at various frame rates, Masters thesis, University of Utah, Salt Lake City, 2006.
Crossref
6. Silverstein, B., Viikari-Juntura, E. and Kalat, J., Use of a prevention index to identify industries at high risk for work-related musculoskeletal disorders of the neck, back, and upper extremity in Washington state, 1990-1998, American Journal of Industrial Medicine, 41(3), 149-169, 2002.
Crossref
Google Scholar
7. Silverstein, B., Welp, E., Nelson, N. and Kalat, J., Claims incidence of work-related disorders of the upper extremities: Washington state, 1987 through 1995, American Journal of Public Health, 88(12), 1827-1833, 1998.
Crossref
Google Scholar
8. Viikari-Juntura, E., Kurppa, K., Kuosma, E., Huuskonen, M., Kuorinka, I. and Ketola, R., Prevalence of epicondylitis and elbow pain in the meat-processing industry, Scandinavian Journal of Work, Environment & Health, 17(1), 38-45, 1991.
Crossref
Google Scholar
PIDS App ServiceClick here!