eISSN: 2093-8462 http://jesk.or.kr
Open Access, Peer-reviewed
eISSN: 2093-8462 http://jesk.or.kr
Open Access, Peer-reviewed
Chao Ma
, Younghwan Pan
10.5143/JESK.2019.38.3.219 Epub 2019 June 29
Abstract
Objective: To study the user's visual behavioral habits of Over-the-counter Blockchain transaction webpages.
Background: With the continuous development of the blockchain, a large number of users conduct off-exchange transactions on the exchange's website, and the user experience is not very well.
Method: Through the eye tracker experiment test and the software (BeGaze) analysis data, as well as the post-experimental questionnaire survey analysis and user interviews, the data is finally integrated and analyzed, and the user's over-the-counter transaction in the blockchain exchange is obtained. Visual behavioral habits on the web. (1) The scope of the study included the user's visual behavioral habits on the web side of the blockchain exchange. (2) Research methods include: quantitative research, qualitative research.
Results: (1) Total eye data were analyzed by independent sample t test, as shown in total eye data. There were significant differences in the number of fixation points and average fixation time between the two pictures; (2) The average number of fixation points of adversary's information area of both tests is obviously higher than the standard deviation, and the standard value of average fixation time is also significantly higher than the standard deviation; (3) The user's demand for the adversary's information area is very low; (4) Users think data is their most urgent need; (5) The heat map shape presents the shape of the waterfall; (6) The eye movement trajectory of most users shows that the user first scans in the vertical direction, then scans in the horizontal direction, and decreases from the top to the bottom.
Conclusion: Five results were obtained through research and analysis, weakening adversary's information, data emphasis, important rules for arrangement of different areas, the arrangement of sequence numbers, waterfall shape visual glance behavior.
Application: The results of this study can be used for the layout guidance of the network side of the OTC transaction of the blockchain exchange, which can improve the service experience of the user on the exchange.
Keywords
Interaction design Visual behavior Blockchain exchange Eye tracking Over-the-Counter (OTC)
With the continuous development of blockchain technology, people are increasingly demanding to trade in digital currency (Crosby et al., 2016) When facing such a large group of users, it is very necessary to understand how web users view web pages in the exchange's OTC transaction area to provide a cognitive basis for the interface designer. Web pages are different from other visual stimuli because they combine text, images, and multimedia content. Eye movement behavior involves different levels of cognitive processes, including eye movements and semantic processes (Henderson et al., 1999). This study investigates ocular determinants on a single web page, including standard eye indicators such as first fixation point, number of gaze points, total gaze time in the area of interest, average gaze time, and eye movement. The key measurement is whether the adversary information is important, whether the data should be emphasized, the importance of different regions, whether the sequence number needs to be arranged, and the user's scanning habits.
2.1 Status Quo analysis
The speed of development in blockchain technology is rapid, while the growth of digital currency transaction volume is also fast (Feixiaohao, 2019). Nowadays, people use digital currency for asset conversion, payment, investment, etc., and thus people's transaction behavior becomes more frequent for various purposes. How to reduce the difficulty of the user's learning curve through the user's habitual experience is worth studying (Abernathy and Wayne, 1974). Besides, digital currency is often linked to national currency. Digital currencies are often used to help users complete their needs through online digital currency exchanges. Accepting electronic payment methods through the exchange to exchange cryptocurrency is what we usually call a "legal currency transaction". The electronic payment method then includes credit card payment, wire transfer or other payment methods to complete the transaction. However, the behavior of such over-the-counter transaction is centralized. In addition, each exchange may be subject to the control of local policy and cannot directly access the payment system (The Law Library of Congress, 2018). This allows the legal exchange to generally adopt online C2C. Therefore, in the process of transaction, the entire transaction process of the currency transaction section is simple, but the over-the-counter transaction section is a lot more complicated for a reason that many links involve manual operation and verification during the process, which is the leading factor to improve the user's fault tolerance rate. It makes the entire transaction process smoother. Through this research, the visual behavior habits of users on the OTC can be analyzed hopefully, and some usability guidance can be provided for future design.
2.2 Conflicts with before
The Jakob Nielsen F-type visual model user is the most cited in the visual usability research on the webpage. When scanning the content area, the user first reads the horizontal content to form the top shape of F (Nielsen, 2006). Next, the user's line of sight moves downward. And then move horizontally, which constitutes the second level of F. Finally, the user scans the left side of the inner pass to scan vertically, and finally forms the vertical trunk of F. The meaning of this pattern indicates that the first line of text on the page receives more gaze than the subsequent lines of text on the same page. The F type is more represented in the web page of the content page type. However, according to research, users are watching this type of web page to be close to the F type, but it is well known that the F-type reading mode is not good for users and businesses (Pernice, 2017).
2.3 Current obstacles
Behavior is guided and constrained by the stimulus environment but, at any given moment, there are an overwhelming number of objects and events competing for visual awareness and control of action (Pan and Geri, 2004). For the exchange, it is more desirable that the first interface that the user sees should be the initial page of the purchase of the digital currency instead of the sale page. From another perspective, after the novice enters the exchange, the platform hopes to be included in the customer faster. The funds enter the pool of their own funds. After a new user enters the exchange interface for the first time, they may encounter various difficulties. What does the meaning of the data mean? What do you need to do after the user does what? What do users need most? What is the area that users are most interested in?
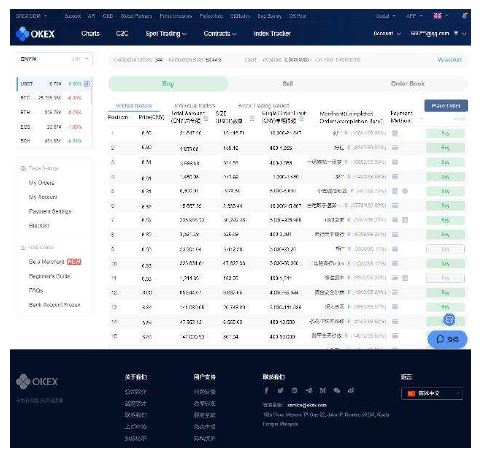
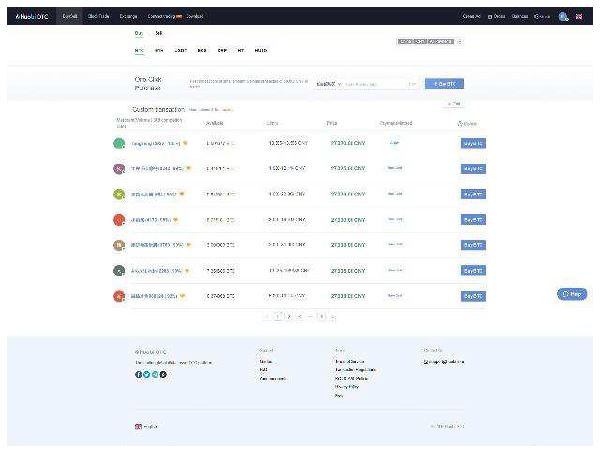
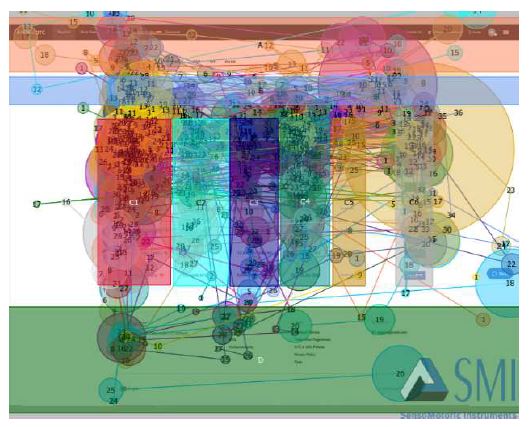
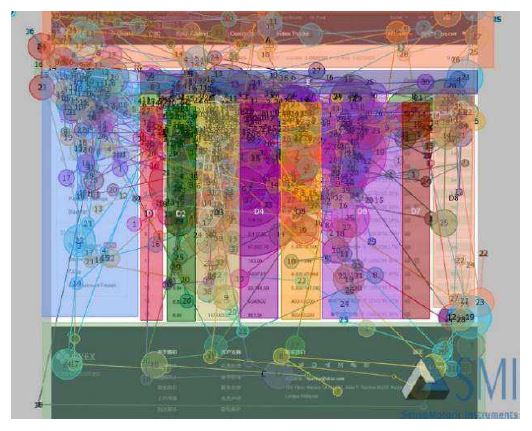
This research focuses on ocular behavior on web pages from different types of sites using eye movement metrics and scan-path analysis. In the OTC-type exchanges, we selected representative exchanges for testing, and selected the pages of Huobi exchange (Figure 1) and Okex exchange (Figure 2) for analysis experiments. Among them are: navigation area, account, market information, shortcut operation, transaction area, help, platform information, which are divided into 7 categories. Navigation area: mainly includes the switching of other sector transactions, such as currency transaction and contract transaction, ETT combination transaction, etc. Account: account information, security information, etc. Quotes Information: Digital currency Gain Index. Quick operation: You can see the order information, funds transfer, payment settings. The parts of the webpages of the two blockchain exchanges are respectively compact and decentralized. The former exhibits more information to meet the daily needs of all users, and mainly adds simple charts of quick operation and market increase to meet the requirements. Intermediate users and expert users. In addition, the tested webpage adopts the method of mixing the main English sub-Chinese fonts. In the subheading, for example, the total amount, etc., is expressed in a mixture of Chinese and English. Considering that there are many Chinese native speakers in this test, in order to reduce the user's understanding of non-native language, it is easy to misunderstand. Thus, Chinese notes was added (Loftus and Mackworth, 1978).
3.1 Subjects
The subjects were mainly from various disciplines, including students, teachers, white-collar workers and other professions. There were 30 subjects, including 2 Korean and 28 Chinese. The subjects ranged in age from 18 to 35, including 19 males and 11 females. This time, the participants belong to the novice level for blockchain exchange and have no experience type.
3.2 Apparatus
Eye tracker is an important instrument to study psychology. It records people's eye movement data and explores people's behavior relationship. SMI Unit RED 5 (Figure 3) was used to record the eye movements of the subjects through an eye tracker. All data flows were collected and transmitted to test center 3.6.53 via a data line. The data obtained were analyzed and exported in BeGaze.

3.3 Stimuli
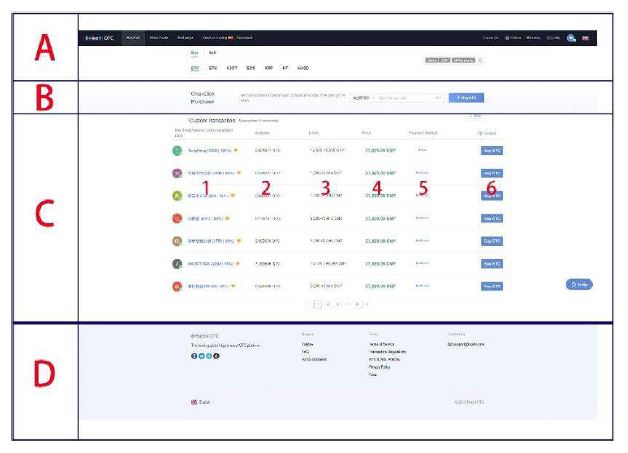
Two tests are shown in (Figure 4) and (Figure 5) respectively. Each participant needed to collect 10 seconds of data for each test. The OTC page (Figure 4) of the Huobi exchange is divided into four ABCD regions, and the C region (Table 1) is divided into six types of information (Buswell, 1935).
|
Information contained in
area C of Huobi exchange |
|
|
1 |
User name; odd number of
users completed in 30 days; positive rate |
|
2 |
Available: digital money
volume |
|
3 |
Limits: single quota range,
calculated in legal currency |
|
4 |
Price: 1 digital currency:
quantity of legal currency |
|
5 |
Payment method (text
display) |
|
6 |
Function keys: purchase |
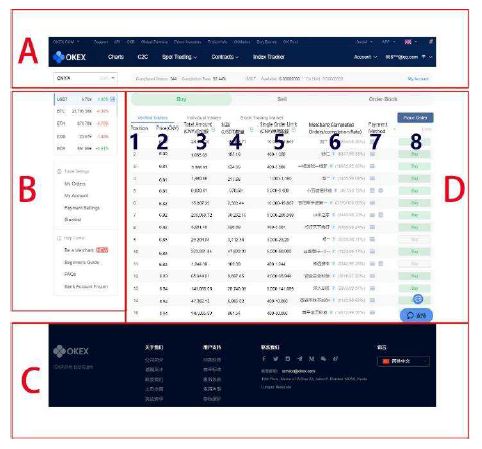
(Figure 5) is the OTC page of Okex block chain exchange, which is divided into four ABCD regions and eight types of information in D region (Table 2).
|
Information contained in
area D of Okex exchange |
|
|
1 |
Sort |
|
2 |
Price: 1 digital currency:
quantity of legal currency |
|
3 |
The total amount converted
in legal currency |
|
4 |
Available: digital money
volume |
|
5 |
Limits: single quota range,
calculated in legal currency |
|
6 |
User name; odd number of
users completed in 30 days; positive rate |
|
7 |
Payment method (graphical
display) |
|
8 |
Function keys: purchase |
Adversary's information area is (Figure 4) C1 and (Figure 5) D6.
Transaction information area is (Figure 4) C area and (Figure 5) D area; Test transaction area is (Figure 4) B area and (Figure 5) B area; Navigation area is (Figure 4) A area and (Figure 5) A area; Other information is (Figure 4) C area and (Figure 5) D area.
3.4 Procedure
The tested web pages were downloaded and saved on the computer hard disk in advance (Josephon and Holmes, 2002). Obtain user's region of interest and eye trajectory (Chun, 2000). After the last page of the test, the participants need to fill in a paper questionnaire. Ask the subjects where they are most interested, which area is the most important, which area you need the most information in the following area, and what area they dislike most. Through the data obtained from software analysis and questionnaire survey (Cooper, 2018), we can get the user's eye behavior when viewing this type of transaction website.
4.1 Total eye data
Total eye data were analyzed by independent sample t test, as shown in (Table 3). There were significant differences in the number of fixation points and average fixation time between the two pictures. The p (statistical test force) values were less than 0.05. Among them, the number of focus points of Okex pictures is significantly higher than that of Huobi pictures, p <.01. The average fixation time on Okex pictures was significantly lower than that on Huobi pictures, p < 0.05.
|
|
Exchange |
N |
M |
SD |
t |
p |
|
Number of fixation points |
OKEX |
30.00 |
59.43 |
8.92 |
3.04 |
.004 |
|
Huobi |
30.00 |
52.73 |
8.12 |
|||
|
Total fixation duration |
Okex |
30.00 |
15967.63 |
1030.64 |
-0.77 |
.44 |
|
Huobi |
30.00 |
16208.11 |
1351.78 |
|||
|
Average fixation duration |
Okex |
30.00 |
276.92 |
59.98 |
-2.45 |
.02 |
|
Huobi |
30.00 |
316.76 |
65.98 |
|||
|
Eye hops |
Okex |
30.00 |
63.47 |
13.45 |
1.27 |
.21 |
|
Huobi |
30.00 |
57.53 |
21.68 |
4.2 Huobi and Okex-Description
Four eye movement indicators were used in the study, namely the duration of the first fixation, the number of fixation points, the total fixation time and the average fixation time in the region of interest. Data are processed by SPSS25.0 statistical software. The data is shown in (Table 4) and (Table 5).
|
Region of |
First fixation point Duration (ms) |
Number of |
Total gaze time in the |
Average gaze |
|
A |
156.11 (159.25) |
1.77 (2.10) |
472.48 (611.73) |
169.91 (150.05) |
|
B |
212.35 (174.28) |
2.47 (2.03) |
719.14 (803.48) |
257.58 (181.40) |
|
C1 |
318.35 (268.79) |
6.40 (3.42) |
2420.52 (1209.21) |
396.61 (140.80) |
|
C2 |
236.11 (186.63) |
2.50 (2.52) |
741.68 (735.76) |
266.17 (167.76) |
|
C3 |
228.95 (153.88) |
2.43 (2.13) |
649.47 (637.17) |
236.82 (135.91) |
|
C4 |
306.58 (281.93) |
3.47 (2.36) |
1081.91 (776.65) |
299.07 (172.89) |
|
C5 |
78.66 (100.98) |
0.53 (0.68) |
95.85 (131.42) |
77.26 (98.43) |
|
C6 |
308.88 (479.83) |
2.03 (1.45) |
693.11 (791.90) |
284.02 (244.99) |
|
D |
102.84 (158.82) |
1.17 (2.07) |
320.69 (648.28) |
108.33 (159.29) |
|
Region of |
First fixation point Duration (ms) |
Number of |
Total gaze time in the |
Average gaze |
|
A |
130.75 (150.94) |
2.38 (2.99) |
490.46 (577.13) |
141.48 (144.28) |
|
B |
259.21 (136.56) |
3.90 (2.93) |
886.85 (633.95) |
235.08 (115.75) |
|
C |
81.58 (131.99) |
0.93 (1.53) |
219.44 (346.20) |
82.48 (121.58) |
|
D1 |
82.76 (109.13) |
0.73 (1.05) |
138.29 (239.80) |
88.92 (115.48) |
|
D2 |
251.72 (204.17) |
2.43 (2.10) |
659.49 (549.28) |
233.47 (146.41) |
|
D3 |
278.84 (149.58) |
4.60 (3.30) |
1422.90 (1106.77) |
320.32 (100.44) |
|
D4 |
249.80 (212.69) |
1.93 (1.39) |
582.28 (690.23) |
272.42 (214.87) |
|
D5 |
221.69 (182.81) |
2.27 (2.13) |
657.92 (681.85) |
212.07 (161.32) |
|
D6 |
255.09 (212.02) |
3.38 (2.77) |
1061.01 (931.72) |
306.31 (213.52) |
|
D7 |
82.24 (163.66) |
0.43 (0.55) |
94.31 (214.92) |
75.25 (125.29) |
|
D8 |
137.58 (142.02) |
1.15 (1.58) |
292.57 (499.06) |
129.72 (137.02) |
|
E |
158.79 (167.00) |
1.60 (1.70) |
348.58 (357.58) |
150.30 (158.33) |
The average number of fixation points of C1 and D6 is obviously higher than the standard deviation, and the standard value of average fixation time is also significantly higher than the standard deviation.
4.3 Questionnaires collected
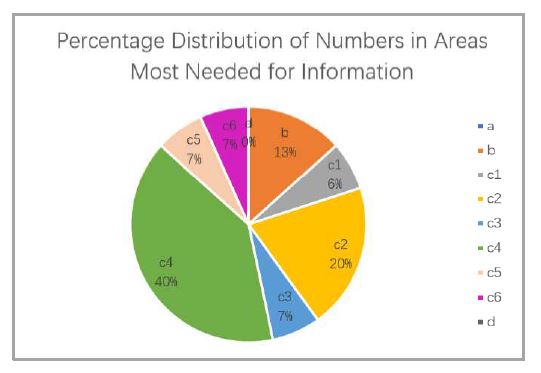
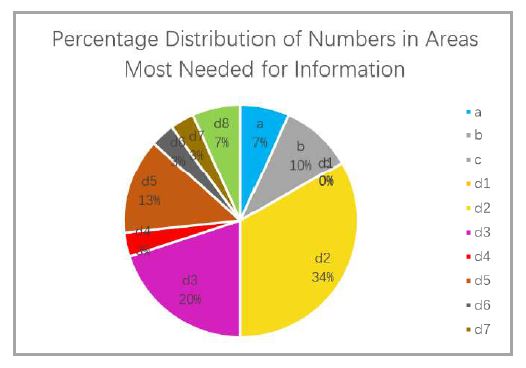
Figure 6 and 7 illustrate the percentage of how many users most need the information of the adversary, and it is shown that it is taken 6% of the c1 area and 3% of the d6 area respectively. The four groups of Huobi exchange data C2, C3, C4, and C5 belong to data emphasis groups, which take up 67% of users' most needed information area. Okex exchange is distributed in D2, D3, D4, D5 regions, accounting for 70% of the total.
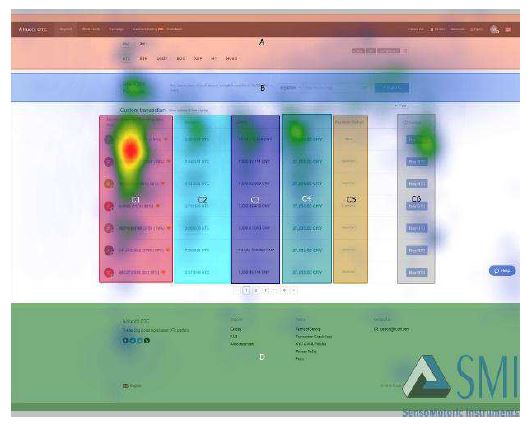
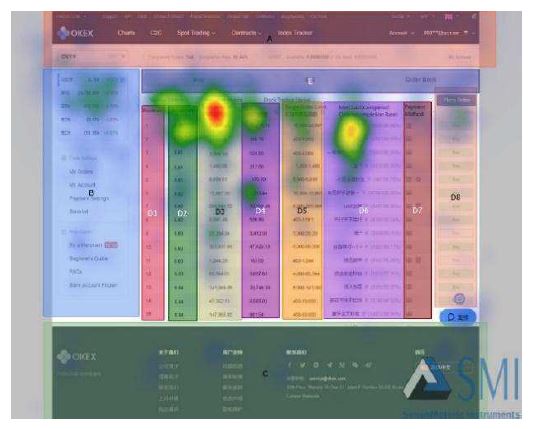
4.4 Heat map
The data can be visualized intuitively from the heat map as shown in (Figure 8) and (Figure 9). The red pass area indicates that the vision stays fixed or lasts for the longest time, while the green one represents relatively less.
4.5 Scan-path analysis
The eye movement (Figure 10) and (Figure 11) trajectory of most users shows that the user first scans in the vertical direction, then scans in the horizontal direction, and decreases from the top to the bottom.
Through a large number of data analysis, we can find that there are many problems in the current exchange design, and there is no reasonable layout. Following is a discussion of the problems found in the study and some guiding suggestions.
5.1 The design principle of weakening adversary's information
After research, it shows that the display of the adversary's information area on the page should be weakened to avoid excessive distracting users' attention. Through experimentation, we found a very interesting point, that after the user first entered the transaction website, the attention of this area was higher, which is reflected in the duration of the fixation point, the number of fixation points, the total fixation duration, as well as the average fixation time. These four indicators are clear, and it is worth noticing that the average of these four indicators are significantly higher than the standard deviation, and the average gaze time data shows that the user's exploration efficiency in this area is very low, and the user spends a lot of time explaining the area. However, after surveys and interviews, it was discovered that users did not believe that this area was very important to them, which creates a conflict between the data and the results of the interview. As we continue to analyze in depth, we find that users are only looking for who they will trade with before transaction, regardless of whether the target of the transaction is just a code name or an avatar, but the virtual adversary appears to help satisfy the user's doubt about who they are dealing with. Therefore, the adversary's information is not very important to the user, but it is also an indispensable part.
5.2 Data emphasis principles
Through eye movement data and questionnaire analysis, it shows that the data in the transaction information area should be emphasized. The data type that needs to be enhanced is price, available, limits, the total amount converted in legal currency.
5.3 Important rules for arrangement of different areas
The result of analysis Important rules for arrangement of different areas: transaction information area > fast transaction area > navigation area > other information.
(1) Transaction information area is the most important. From the data, we can see that transaction area includes adversary's information, unit price of transaction, total amount of digital currency, conversion amount of legal currency, and single price limit, payment method and other information, which is the most important information for layout.
(2) The fast transaction area refers to the function that can help the user to quickly enter a certain function area or understand the market information. It can quickly obtain valuable information and other areas, and the importance of this area should be second only to the transaction information area.
(3) The importance of the navigation area should be arranged after the fast transaction. Navigation plays a guiding role and should not distract the user's attention too much.
(4) Other information may include the introduction of the website, contact information, cooperation methods, etc. This information is not important to the average user. Users may choose to look for information in this area when they encounter specific needs, and this area does not have much impact on the entire transaction process, so this area should be the weakest to avoid distracting users' force.
5.4 The arrangement of sequence numbers
Through comparative analysis of experiments, users will automatically arrange data by default from top to bottom from the subconscious. Thus, the existence of sequence numbers has no effect on users.
5.5 Waterfall shape
Through heat map and scan-path analysis, we can find that users always scan this kind of web pages in waterfall shape.
First, users scan vertically from the top down, which forms the vertical backbone of the waterfall.
Secondly, users will scan horizontally every time they move from top to bottom, and the frequency of mobile comparison will decrease with the vertical direction. This results in a larger top and smaller downward.
The findings of this research indicate that:
Through eye movement data analysis and questionnaire survey results. The display of the adversary's information area on the page should be weakened to avoid excessive distracting users' attention. But it does not mean that this area is not important at all. Adversary risk is a key consideration in over-the-counter (OTC) markets because of its importance to market participants, financial institutions and the real economy (Christoph et al., 2005). Users prefer doing transactions in presence of transaction adversary that they trust and who can help them if something goes wrong with the transaction. OTC transactions are the closest model to mechanisms they are used to, i.e. money transfers with post offices and couriers (Garcia, 2016). We can use the USSD technology to let users establish contacts in private to solve the problem of users looking for familiar counter party's information.
Through eye movement data and questionnaire analysis shows that the data in the transaction information area should be emphasized. The data type that needs to be enhanced is price, available, limits, the total amount converted in legal currency. This area can be appropriately visually weakened when designing. However, it cannot be completely deleted in a way that retaining the most important information such as completion rate and number of completed orders or favorable rate is important, and the name of the adversary can be displayed by avatar and username. Another shortcoming is that although the analysis of the current survey supports this, most of the subjects who are selected for the experimental subjects are new or have little experience. Thus, the experiment cannot determine whether intermediate users and expert users have the same feedback on this area.
The result of analysis Important rules for arrangement of different areas: transaction information area > fast transaction area > navigation area > other information. When designing the layout of the page, designers should carry out a reasonable layout according to the progressive importance of these four areas, while the most crucial one is the transaction area. Therefore, the transaction area should be the key object, followed by the fast transaction area, then the navigation area and other information.
Through comparative analysis of experiments, users will automatically arrange data by default from top to bottom from the subconscious. Thus, the existence of sequence numbers has no effect on users. Sequence learning is inherent in human ability because it is conscious and unconscious learning. When users see the price of each line in the transaction area, they will unconsciously arrange themselves. So there is no need to display sequence numbers to add unnecessary information.
Through the study of eye tracking, we found that the user's visual glance is in a waterfall shape, which is different from the shape of the F-shaped glance that we usually think the result to be. First, users scan vertically from the top down, Secondly, users will scan horizontally every time they move from top to bottom, and the frequency of mobile comparison will decrease with the vertical direction. Therefore, when the information of the transaction area is laid out, the space between each column of data should not be too narrow, and the user scans the top information more and always compares horizontally.
References
1. Abrahão, S., Cachero, C. and Matera, M., Journal of Web Engineering, Web usability and accessibility, pp. 257, 2004 (retrieved, May 10, 2019).
2. Benel, D., Ottens, D. and Horst, R., Use of an eye tracking system in the usability laboratory, Proceedings of the Human Factors Society 35th Annual Meeting, 2016 (retrieved March 19, 2019).
Google Scholar
3. Buswell, G., How People Look at Pictures, University of Chicago Press, Chicago, IL, 1935 (retrieved March 20, 2019).
Google Scholar
4. Christoph, F., Agostino, C. and Celso, B., Managing adversary Risk in OTC Markets, Finance and Economics Discussion Series Divisions of Research & Statistics and Monetary Affairs Federal Reserve Board, Washington, D.C., 2005 (retrieved May 15, 2019).
5. Chun, M., Contextual Cueing of Visual Attention-Marvin, Scuence Direct, https://www.sciencedirect.com/science/article/pii/ S1364661300014765, 2000 (retrieved May 3, 2019).
Crossref
Google Scholar
6. Cooper, A., About Face 4: The Essentials of Interaction Design, pp.26-48, 2018 (retrieved April 3, 2019).
7. Crosby, M., Nachiappan, Pradan, P., Technology: Beyond Bitcoin, 2016 (retrieved May 16, 2019).
8. Drusch, G., From gaze plots to eye fixation patterns using a clustering method based on Hausdorff distances, 2011 (retrieved, April 2, 2019).
Google Scholar
9. Feixiaohao, Bitcoin Market Price, https://www.feixiaohao.com/, 2019 (retrieved February 20, 2019).
10. Garcia, A., OTC vs NSDT: A New Perspective on Solving the Mobile Money Usage Problem, https://www.findevgateway.org/library/ otc-vs-nsdt-new-perspective-solving-mobile-money-usage-problem, 2016 (retrieved May 15, 2019).
11. Hayhoe, M.M., Ballard, D.H., Triesch, J., Shinoda, H., Aivar, P. and Sullivan, B., Vision in Natural and Virtual Environments, In Eye Tracking Research & Applications (ETRA) Symposium, ACM, 7-13, 2007 (retrieved March 20, 2019).
12. Henderson, J.M., Weeks, P.A. and Hollingworth, A., The Effects of Semantic Consistency on Eye Movements During Complex Scene Viewing, Journal of Experimental Psychology: Human Perception and Performance, 25, 1999 (retrieved March 16, 2019).
Google Scholar
13. Josephon, S. and Holmes, M.E., Visual Attention to Repeated Internet Images: Testing the Scanpath Theory on the World Wide Web. In Eye Tracking Research & Applications (ETRA) Symposium, ACM, 43-51, 2002 (retrieved March 19, 2019).
Google Scholar
14. Loftus, G.R. and Mackworth, N.H., Cognitive determinants of fixation location during picture viewing, Journal of Experimental Psychology: Human Perception and Performance, 4, 565-572, 1978 (retrieved April 20, 2019).
Crossref
Google Scholar
15. Nielsen, J., Norman Group, https://www.nngroup.com/articles/f-shaped-pattern-reading-web-content-discovered/, 2006 (retrieved March 17, 2019).
16. Pan, B. and Geri, G., The Determinants of Web Page Viewing Behavior: An Eye-Tracking Study, Information Science Program Department of Communication, 2004 (retrieved March 2, 2019).
Google Scholar
17. Pernice, K., Exhaustive Review or "I Can't Believe It's Not There" Phenomenon: Evidence from Eye tracking, https://www.nngroup.com /articles/exhaustive-review-eye tracking/ (retrieved March 29, 2019).
18. Pernice, K., F-Shaped Pattern of Reading on the Web: Misunderstood, But Still Relevant (Even on Mobile), https://www.nngroup.com /articles/f-shaped-pattern-reading-web-content/ (retrieved February 20, 2019).
Crossref
19. The Law Library of Congress, Global Legal Research Center, Regulation of Cryptocurrency Around the World. 2018. [In the United States]
20. 30 CGAP, Consumer insights from Bangladesh: Is a transition to Mobile Wallets Underway, http://www.slideshare.net/CGAP/is-a-transition-to-mobile-walletsunderway-in-bangladesh (retrieved May 16, 2019).
Crossref
PIDS App ServiceClick here!