eISSN: 2093-8462 http://jesk.or.kr
Open Access, Peer-reviewed
eISSN: 2093-8462 http://jesk.or.kr
Open Access, Peer-reviewed
Hyun-Ho Shim
, Kyeong-Hee Choi
, Yong-Ku Kong
, Chae-Won Park
, Seoung-Yeon Kim
, Min-Jung Kim
, Min-Uk Cho
10.5143/JESK.2020.39.2.143 Epub 2020 May 03
Abstract
Objective: The aim of this study was to identify changes in bio-parameters before and after muscle fatigue according to the health status of the lumbar muscles.
Background: Low back pain is frequently occurring pain area in various industrial field. There are a lot of researches that compare bio-parameters on healthy people and low back pain patients or analyze the change on bio-parameter by fatigue effect. However, researches that compare bio-parameters on lumbar muscle health and fatigue are insufficient.
Method: The experiment was conducted on 15 male adults. All participants performed Sorensen test that was consist of 30 seconds of task / 30 seconds of rest for 20 minutes. Myovision was used to classify muscle and people health condition into three types (chronic, normal, acute) according to muscle activity and a variety of bio-parameters were used to compare fatigue pre/post.
Results: As a result, the Flexion Relaxation Ratio (FRR) decreased in the normal muscle group and increased in the acute muscle group after muscle fatigue. Although generally the %frequency decreased in all of group, the decrease in normal muscle groups was lower than in chronic/acute muscle groups. Overall, subjective discomfort increased in all muscle groups, but the increase discomfort in normal muscle groups was lower than that of acute muscle groups.
Conclusion: In general, healthy muscle groups showed a decrease in FRR after muscle fatigue, while non-healthy muscle groups showed an increasing trend. Therefore, when assessing muscle fatigue from performing a task using FRR, it might be said that post-classification of muscle health conditions should be performed and then interpreted. In addition, non-healthy muscle group was found to be more vulnerable to fatigue by using fatigue parameters and subjective discomfort. Therefore, non-healthy muscle groups were likely to require continuous monitoring in industrial field.
Application: Changes in FRR after fatigue would be evaluated differently between healthy and non-healthy muscle groups.
Keywords
Flexion-Relaxation Phenomenon (FRP) Fatigue evaluation Lumbar health condition Myovision Work-related musculoskeletal disorders
근골격계 질환은 반복 작업, 장기간의 무리한 자세 등으로 인해 근골격계 부위의 손상이 누적된 결과로 인해 나타나는 기능적 장해를 의미한다(Kim et al., 2010). 이러한 근골격계 질환은 허리, 목, 어깨, 전완, 손 등의 다양한 신체 부위에 통증을 유발한다(Punnett and Wegman, 2004). Lim et al. (1998)은 허리 부위의 운동량이 많고 그에 따른 다양한 위험 요인에 노출되어 있기 때문이며, Deyo et al. (1990)은 80%의 사람들이 일생에 한번 이상의 허리 통증을 경험한다고 보고하였다. 선행 연구의 결과를 보았을 때, 허리 부위는 특히 근골격계 질환에 취약하다는 것을 파악할 수 있으며, 이런 경향은 산업현장에서도 동일하게 나타나는 것을 확인할 수 있다. Carter and Banister (1994)는 VDT 작업 종사자의 경우 허리 통증이 가장 흔하게 나타난다는 것을 보였으며, Waddell (1987)은 VDT 작업자의 약 80%가 일상생활에서도 허리 통증을 경험한다는 보고를 했다. VDT 종사자 외에도 제조업 종사자 또한 다양한 선행 연구를 통해 동일한 경향을 확인할 수 있다. Yi et al. (2000)은 제조업 종사자 97명 중 67%가 요통을 경험한다고 보고하였고, Kim et al. (1993)은 남성 제조업 종사자 608명 중 25%가, Jung et al. (2001)은 여성의 경우 166명 중 59.8%가 허리 통증을 경험하고 있다는 연구 결과를 발표하였다.
Flexion-Relaxation Phenomenon (FRP)은 허리의 건강을 평가하기 위해 사용되는 다양한 지표 중 하나이다. FRP는 신체의 굴곡이 진행됨에 따라 근전도 신호의 amplitude가 특정 굴곡 구간에서 급격하게 감소하는 현상을 말하며 이 구간을 근전도 휴지(silence) 구간이라고도 부른다. 이 현상은 active tissue(근육)에서 부담하는 하중이 passive tissue(디스크, 인대, 건)로 전이되기 때문에 나타나게 되는데(Floyd and Silver, 1951; McGill and Kippers, 1994) 이러한 현상은 만성 허리 통증 환자, 혹은 디스크와 같은 신경계 질환이 있는 경우 잘 나타나지 않는 경향이 있어 허리의 건강 상태를 평가하는 지표로서 사용되었다(Nouwen et al., 1976; Collaca and Hinrichs, 2005; Paoloni et al., 2011). 또한 FRP 과정에서 보여지는 근전도를 통해 산출되는 다양한 변수를 이용하여 허리의 건강 정도를 정량화 할 수 있다. 그 중 Flexion-Relaxation Ratio (FRR)는 근전도 휴지 구간과 근전도 활성 구간의 비율을 의미하는데, Watson et al. (1997)과 Neblett et al. (2013)는 만성 허리 통증 환자의 경우 건강 그룹보다 FRR이 낮다는 연구 결과를 보였으며, Li et al. (2019)은 디스크 환자의 수술적 치료 이후 FRR이 커진다는 결과를 보였다. FRR은 단순히 건강의 지표 외에도, 근육의 피로 수준을 평가하기 위한 정량적 지표로 사용되기도 한다. 기존 연구사례에 따르면, 일반적인 경우 근육의 피로 후, 정상 그룹의 경우 FRR은 감소하는 경향을 보인 반면, 통증 환자는 반대로 증가하는 경향을 보였다(Zabihhosseinian et al., 2015).
FRR 뿐 아니라 EMG-off 또한 근육의 피로를 평가하는 데 사용되는 지표 중 하나이다. EMG-off time은 근전도가 휴지하기 시작하는 지점을 말하며 Jin (2018)은 피로 후에 EMG-off 현상이 빠르게 나타나는 결과를 확인하였다. EMG-off는 Frequency와 함께 근육의 피로를 평가하는 지표로 사용될 수 있다.
이러한 선행 연구는 주로 통증 환자와 건강군의 FRR을 단순 비교하거나, 피로 후 목의 FRR 변화, 허리 건강 그룹의 피로에 따른 FRR 변화 등, 주로 FRR 위주의 연구를 진행했다는 한계점이 있다. 따라서 본 연구는 허리 건강 그룹과 비 건강 그룹을 분류하고, 허리의 피로에 따른 다양한 생체 지표의 변화 양상에 대해 분석하는 것을 목표로 하고 있다.
2.1 Participants
본 연구는 상지에 근골격계 질환이 없는 20대 남성 15명을 대상으로 이루어졌다. 피험자의 평균 연령은 24.4±2.3세였으며, 평균 신장은 175.9±4.2cm, 평균 체중은 77.1±11.0kg이었다.
2.2 Experimental equipment
피험자의 허리 근전도 신호를 수집하기 위해 Noraxon 사의 근전도 측정기 DTS system (TeleMyo 2400 DTS, Noraxon, Arizona, USA)를 이용하였다. 전극은 L3와 L4 위치의 척추기립근 좌·우에 부착하였으며(Geisser et al., 2004), 데이터는 1,000Hz로 수집하였고, 주파수 대역폭 20~400Hz로 필터링하였다.
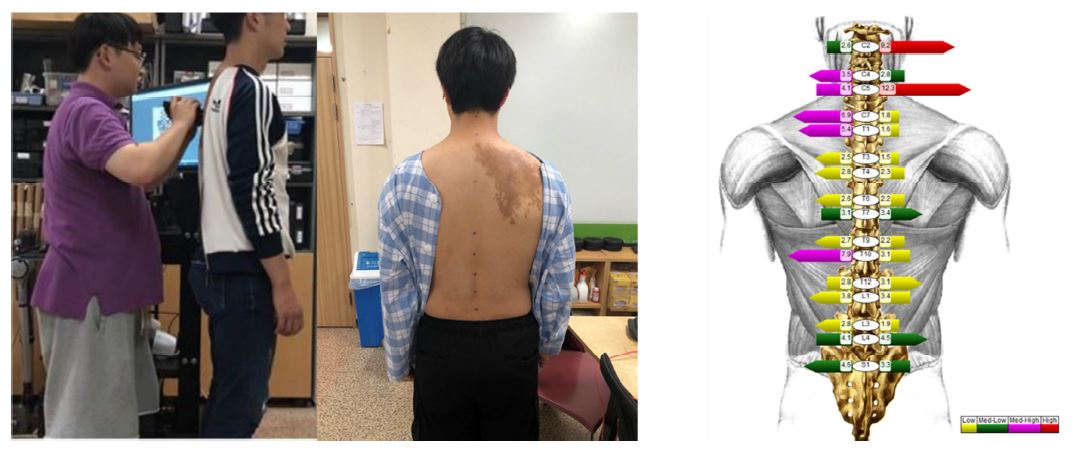
또한, 피험자의 허리 근육 건강도를 평가하기 위해 MyoVision 사의 4채널 표면 근전도 Scan vision (MyoVision 3G WireFree, MyoVision Inc., USA)를 이용하였다. MyoVision은 표면 근전도를 이용하여 척추기립근의 건강 정도를 간단하고 빠르게 측정할 수 있도록 개발되었다. 측정 결과는 총 네 단계로 구성되어 있는데(Figure 1), 결과값 순서대로 노란색 막대(Bar)는 가장 낮은 근전도 값을 보이며 근육이 피로하여 약화되어 있음을 의미한다. 초록색은 정상 범주의 근육임을 의미하고, 자주색은 근육의 긴장 상태, 빨간색은 근육의 과 긴장 상태를 의미한다. 전극 부착 위치에 따라 근활성도의 차이가 나타날 수 있다는 선행 연구를 고려하여(Lee, 2017), 모든 피실험자들의 좌·우측 및 L3·L4 위치의 흉최장근(Longissimus Thoracis Muscle) 각각에 대한 건강 정도를 MyoVision을 이용하여 측정 및 평가하였다(Sihoven et al., 1991).
각 피험자의 좌·우측 L3 및 L4 위치의 척추기립근 각각의 Myovision 측정 결과값을 이용하여 각 근육을 Chronic, Normal, Acute 세 가지의 상태로 분류를 진행하였으며, Chronic의 경우 L3는 0~4, L4는 0~3으로, Normal의 경우 L3는 4.1~8.9, L4는 3.1~7로, Acute의 경우 L3는 9 이상, L4는 7.1 이상으로 나뉘었다(Table 1).
|
|
Lumbar muscle |
|
|
L3 |
L4 |
|
|
Chronic |
0.0~4.0 |
0.0~3.0 |
|
Normal |
4.1~8.9 |
3.1~7.0 |
|
Acute |
Over 9.0 |
Over 7.1 |
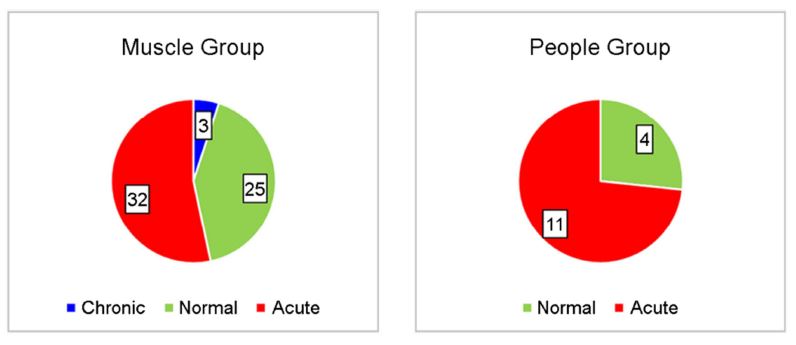
Table 1의 기준에 의해, '근육 별 건강 그룹'(Chronic/Normal/Acute)으로, 60개의 근육은 Chronic muscle group으로 3개의 근육이, Normal muscle group으로는 25개의 근육이, 그리고 Acute muscle group으로는 32개의 근육이 각각 분류되었다(Figure 2, left).
또한 '피험자 별 건강 그룹'(Normal/Acute)의 평가를 위해, 좌·우측 및 L3·L4 위치의 근육 총 4개 중 가장 많은 비중을 차지하는 근육(4개 중 2개 이상)의 건강 상태를 기준으로 피험자의 허리 건강 상태를 결정하였다. 그 결과, chronic 그룹의 근육을 2개 이상 보유한 피험자는 존재하지 않았으며, 피험자 별 허리 건강 그룹은 4명의 Normal 그룹과 11명의 Acute 그룹으로 각각 분류하였다(Figure 2, right).
2.3 Experimental procedure
실험을 시작하기 전, 피험자에게 실험의 목적, 변수 측정 방법과 같은 실험 정보를 제공하였다. 그 후, 피험자의 신체 정보와 허리의 주관적 불편도를 측정하였다. 생체 신호를 측정하기 이전, 피험자의 허리 근육의 긴장을 완화하기 위해 준비 운동으로 허리 근육의 신장 운동을 진행하였다.
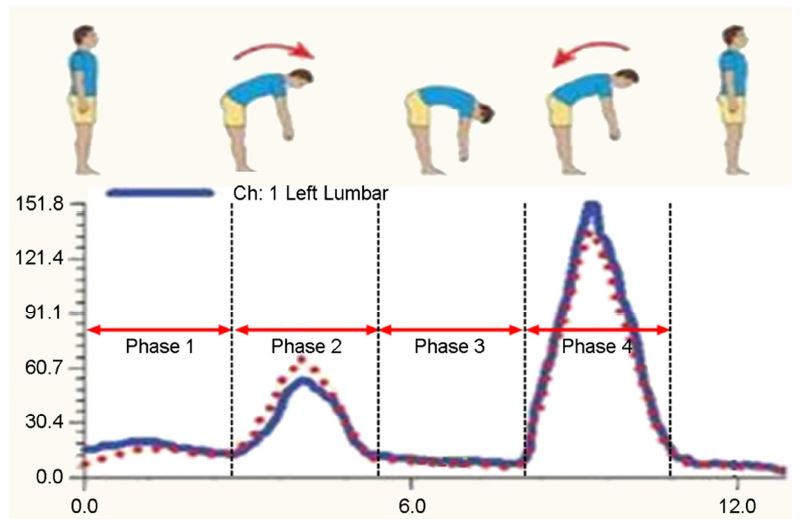
각 피험자의 허리 불편도를 측정한 후, MyoVision 장비를 이용하여 피험자의 허리 건강 상태를 측정하기 위해 피실험자는 허리를 곧바로 핀 중립 자세를 취한 채로 정면을 향한 자세에서 L3와 L4 위치의 척추기립근을 2회 측정하였다. 허리 근육의 flexion-relaxation test를 진행하기 위해, MyoVision 측정 후 L3와 L4 위치의 척추기립근 좌·우에 근전도를 부착하였다. 허리의 flexion-relaxation test 진행을 위해 Figure 3과 같이 4단계로 진행하였으며, 각 단계를 4초로 구성하여 3회를 반복하여 측정하였다. 각 단계별로 일정한 시간을 부여할 수 있도록 메트로놈을 이용하여 청각적 피드백을 제시하였다.
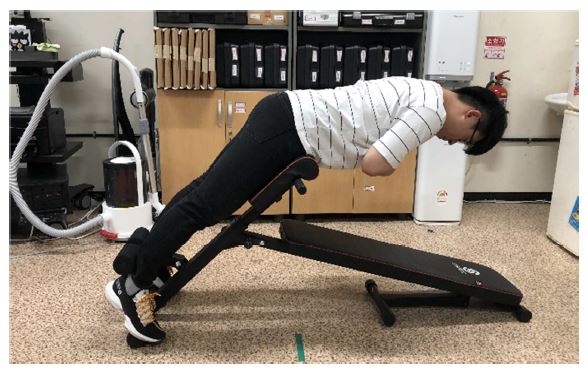
본 연구에서의 Task로는 허리 근육의 피로 수준을 평가하기 위해, Sorensen test를 진행하였다(Coorevits et al., 2008; Hart and Ingersoll, 2010). Task 수행 시 상체는 지면과 평행한 상태로 다리는 지면과 40°를 이루며(Dedering et al., 1999), 팔은 가슴에 모은 자세(Mayer et al., 1999; Hart and Ingersoll, 2010)로 진행하였다(Figure 4). Task는 30초 수행과 30초 휴식의 1분 Cycle로 구성되었으며 20회 반복하여 총 20분 동안 task를 수행하도록 누적하였다.
2.4 Experimental design
독립변수로 Task 시간(Task 전/후, Task 초반/후반)과 근육 별 건강 그룹(Chronic/Normal/Acute), 피험자 별 건강 그룹(Normal/Acute)을 설정하였다. Task 시간의 경우, 전/후는 Task를 시작하기 전과 후의 변화를 비교하기 위하여 측정하였으며, Task 초반/후반의 경우 Task의 수행 시간에 따른 변화를 비교하기 위해 20분의 Task 중 초반 30초와 후반 30초의 데이터를 수집하였다.
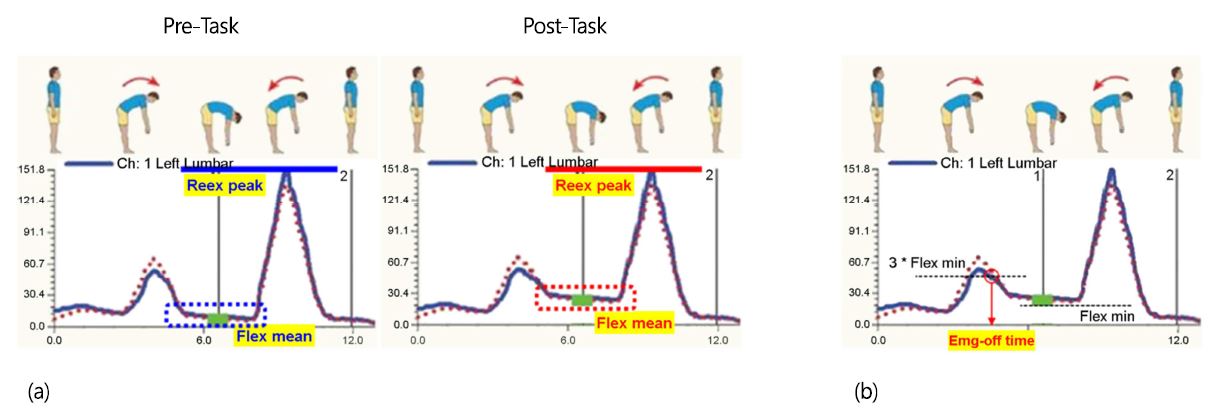
종속변수로는 Flexion-Relaxation Phenomenon (FRP) 변수인 'Flex mean'과 'Reex peak', 'Flexion-Relaxation Ratio (FRR)'을 측정하였다. FRP test의 측정 과정은 Phase 1) 중립 자세 유지, Phase 2) 최대 굴곡을 향해 굴곡, Phase 3) 최대 굴곡 유지, Phase 4) 중립 자세 회귀의 네 단계로 구성되어 있다.
'Flex mean'은 최대 굴곡 구간(Phase 3)의 평균 값이며 'Reex peak'는 중립 자세 회귀 구간(Phase 4)의 최대값을 의미한다. 'FRR'은 Eq. 1로 정의하여 'Flex mean'과 'Reex peak'의 비율을 의미한다(Maroufi et al., 2013; Neblett et al., 2013). FRR은 일반적인 경우 피로 후에 Figure 5(a)와 같이 감소하는 경향을 보이지만, 통증 환자는 반대로 증가하는 경향을 보이기도 한다(Zabihhosseinian et al., 2015).
FRP 관련 변수는 Task 전과 후에 측정하여 비교하였다. 피로 관련 변수로는 'EMG-off time (sec)'와 '%Frequency'를 측정하였다. 'EMG-off time'은 FRP 현상 진행 중 하중 부하가 active tissue에서 passive tissue로 전이되는 순간을 말하는데, Figure 5(b)와 같이 근전도 값이 Phase 3의 평균 값인 Flex mean의 3배에 대응하는 Phase 2의 지점 중 큰 값으로 정의하였고(Jin et al., 2012), Task 전과 후에 측정하여 비교하였다. '%Frequency'는 median frequency를 이용하여 Task 초반 30초와 후반 30초의 데이터의 변화 비율을 비교하였다(Won et al., 2001). 또한, 모든 FRP 관련 변수와 피로 관련 변수는 L3와 L4 위치의 척추기립근의 평균 값을 이용하였다. 마지막으로 피험자의 주관적 불편도를 측정하기 위하여 VAS fatigue scale을 이용하였다(Kelly, 1998; Wolfe, 2004).
2.5 Statistical analysis
통계분석은 SPSS (SPSS Inc, release 18.0, Chicago, Illinois, USA)를 이용하여 분석하였으며, 유의수준은 0.05로 설정하였다. Task 전/후와 Task 지속 시간 및 허리 건강 그룹에 따른 종속변수의 변화를 확인하기 위해 FRP 관련 변수를 제외한 모든 종속변수에 대해 일변량 분산분석(Two-Way-ANOVA)를 수행하였다. FRP 관련 변수의 경우 세 종속변수의 관계를 분석하기 위하여 다변량 분산분석(MANOVA)을 수행하였다. 마지막으로 교호작용을 확인하기 위하여 독립표본 T-검정을 수행하였다.
3.1 Muscle group
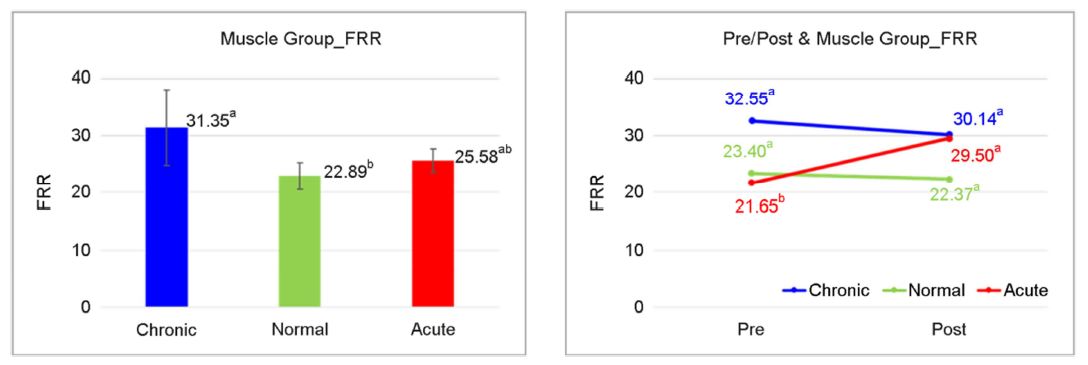
FRP parameter 중 FRR (Flexion-Relaxation Ratio) 값은 근육 별 건강 그룹에 대해 통계적으로 유의한 결과를 보였다(p<0.05). Normal muscle group이 22.89로 가장 작은 결과를 보였으며, Acute muscle group과 Chronic muscle group은 각각 25.58과 31.35의 결과를 보였다(Figure 6, left). 근육 별 건강 그룹과 Task 전/후와의 교호작용 또한 유의한 결과를 보였는데(p<0.05), Acute muscle group에서는 Task 전 21.65에서 Task 후 29.50로 유의하게 증가하는 경향을 보인 반면, Chronic과 Normal muscle groups의 경우는 감소하는 경향을 보였다(Figure 6, right).
피로 관련 변수 중 %Frequency는 Task 시간(Task 초반/후반)에 대해 유의한 결과를 보였다(p<0.05). Task 초반과 비교하여 후반에 0.93으로 유의하게 감소하는 결과를 확인할 수 있었다. 교호작용의 경우 통계적인 유의한 차이를 보이지 않았지만, Normal muscle group은 후반에 0.98로 가장 작은 감소폭을 보인 반면, Acute와 Chronic muscle group은 각각 0.95와 0.86로 감소하는 결과를 보였다.
3.2 People group
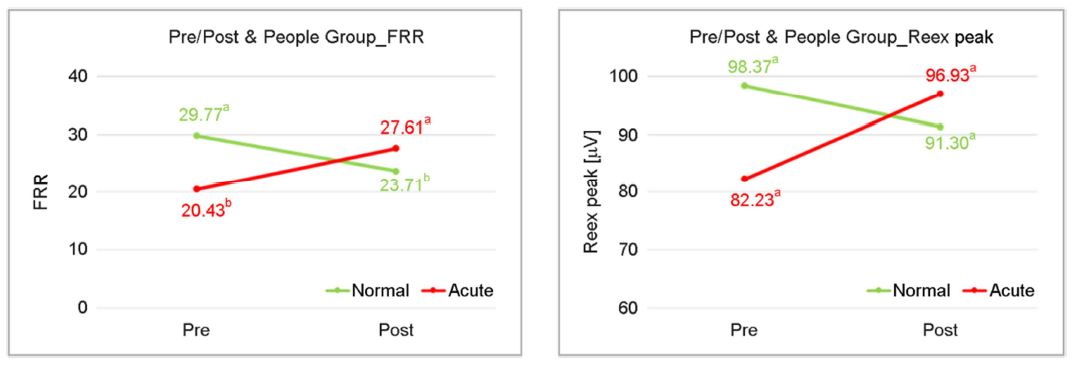
FRP parameter 중 FRR 값과 Reex peak 값은 피험자 별 건강 그룹과 Task 시간(Task 전/후)에 대한 교호 작용에서 유의한 결과를 보였다(p<0.05). Normal 그룹의 경우 Task 전 29.77에서 23.71로 유의하게 감소하는 결과를 보인 반면, Acute 그룹의 경우 20.43에서 27.61로 유의하게 증가하는 결과를 확인할 수 있었다(Figure 7, left). Reex peak 결과는 비록 통계적으로 유의하지는 않지만, FRR과 매우 유사한 경향을 보였는데, Normal 그룹의 경우 98.37에서 91.30으로 감소하는 경향을 보였고, Acute 그룹은 83.23에서 96.93로 증가하는 경향을 보였다(Figure 7, right). 분석 결과로 인해 Task 전/후와 피험자 별 건강 그룹의 차이는 Reex peak와 FRR에 의해 서로 다른 형태의 경향을 보인다는 것을 확인할 수 있었다.
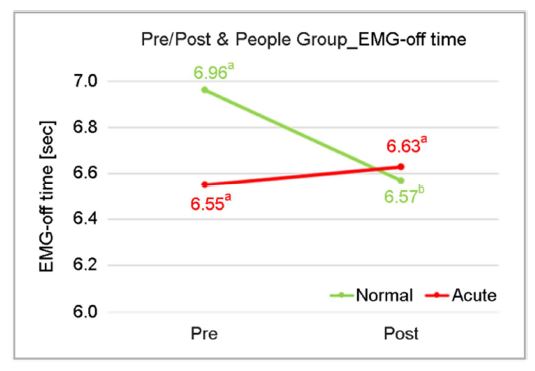
피로 관련 변수 중 EMG-off time은 피험자 별 건강 그룹과 Task 시간(Task 전/후)에 대한 주 효과 및 교호작용 모두에서 유의한 결과를 보였다(p<0.05). Task 전(6.76초)과 비교하여 Task 후(6.60초)에 EMG-off가 빠르게 나타나는 결과를 보였다. 또한 Normal 그룹(6.77초) 과 비교하여 Acute 그룹(6.59초)이 EMG-off가 더 빠르게 나타나는 경향을 확인할 수 있었다. Normal 그룹은 실험 전(6.96초)에서 실험 후(6.57초)로 통계적으로 유의하게 감소하는 경향을 보인 반면, Acute 그룹은 실험 전(6.55초)에서 실험 후(6.63초)로 증가하는 경향을 보였다(Figure 8).
%Frequency는 통계적으로 유의한 차이는 존재하지 않았지만, Task 초반과 비교하여 후반에 0.97로 감소하는 결과를 확인할 수 있었다. 교호작용 또한 유의하지는 않지만, Normal 그룹의 경우 Task 초반과 비교하여 후반에 0.99로 감소하는 반면, Acute 그룹은 0.95로 감소하는 경향을 보였다. 주관적 불편도는 Task 시간(Task 전/후)에 대해 유의한 차이를 보였으며(p<0.05), Task 전(2.0점)과 비교하여 Task 후(4.3점)에 불편도가 높은 결과를 확인할 수 있었다.
4.1 FRP parameter
근육 별 건강 그룹에서 FRR은 Acute muscle group만이 유의하게 증가하는 결과를 보였다. 이것은 목 통증 환자는 피로 후에 FRR이 증가한다는 선행 연구의 결과(Zabihhosseinian et al., 2015)가 허리 근육에도 동일한 경향을 보이는 것을 확인할 수 있었다. 피험자 별 건강 그룹의 경우에서도 역시 Reex peak와 FRR에 의한 교호작용이 유의한 결과를 보였으며, 두 종속변수 모두 Normal 그룹은 Task 후에 감소, Acute 그룹은 Task 후에 증가하는 경향을 확인하였다. 자세 유지를 위해 목 부근의 근육에 많이 필요한 피로 저항성을 가진 지근 섬유(Slow Twitch Fibers)가 건강한 그룹에 비해 목 통증이 있는 그룹에서 적기 때문에(Mannion et al., 1997; Boyd-Clark et al., 2001), 목의 신전 운동을 통해 원래 자세로 회귀하는 단계에서 목 통증이 있는 그룹이 목 폄근(Cervical Extensor Muscle)이 건강한 그룹보다 더 많은 근활성도를 필요로 한다. 그 결과, 목 통증 그룹의 Reex peak 값이 건강한 그룹에 비해 더 많이 증가한다는 선행 연구(Zabihhosseinian et al., 2015)의 결과로 본 연구의 결과를 동일하게 해석할 수 있을 것으로 사료된다. 또한 본 연구 결과에서 Reex peak와 FRR에 의한 변화는 유의했지만 Flex mean은 유의한 결과를 보이지 않았는데, 이것은 목 통증 환자의 FRR은 Flex mean보다 Reex peak 값에 더 큰 영향을 받는다(Zabihhosseinian et al., 2015)는 선행 연구와 동일한 결과라고 할 수 있다.
4.2 Fatigue parameter
EMG-off time은 피험자 별 건강 그룹에서 통계적으로 유의한 결과를 보였다. Task 후에 EMG-off 현상이 빠르게 나타나는 것을 보여, 근육이 피로해지면 EMG-off가 빠르게 일어난다는 선행 연구와 동일한 결과를 확인할 수 있었다(Jin and Mirka, 2015; Jin, 2018). 또한 Normal 그룹의 EMG-off가 Acute 그룹보다 EMG-off가 유의하게 늦게 일어나는 것을 확인할 수 있었는데, 이것은 Acute 그룹의 허리 근육이 Normal 그룹의 허리 근육보다 더 피로한 상태에 있는 것으로 보인다.
%Frequency는 근육 별 건강 그룹과 피험자 별 건강 그룹 모두 피로 후에 감소하는 결과를 보였다. 이것은 허리 근육에 피로가 쌓이면 Frequency가 감소한다는 선행 연구와 동일한 결과라고 할 수 있다(Kankaanpaa et al., 1997; Dolan and Adams, 1998; Coorevits et al., 2008). 또한 근육 별 건강 그룹의 감소폭의 크기는 Normal-Acute-Chronic 순서로 컸으며, 피험자 별 건강 그룹의 감소폭의 크기 또한 Normal-Acute 순서였다. 이 결과는 상대적으로 허리의 건강 상태가 좋은 Normal 그룹에 비해 Acute와 Chronic 그룹이 피로에 더 예민하게 반응하여 더 크게 감소한 것으로 보인다.
본 연구의 목적은 허리 근육의 상태에 따른 근육 피로 전/후의 생체 지표의 변화를 비교하는 것이다. 허리 건강 상태에 따른 피로 전/후의 생체 지표의 변화는 Normal 그룹은 피로 후 FRR의 값이 감소하며, 피로에 비교적 둔감하게 반응하는 결과를 확인할 수 있었고, Acute 그룹은 피로 후에 FRR의 값이 증가하며 피로에 예민하게 반응하는 결과를 확인할 수 있었다. Chronic 그룹의 경우 본 연구에서는 수가 적어 명확한 경향을 파악하기에는 다소 어려웠다.
본 연구의 한계점으로는 본 연구의 피험자가 20대 대학생, 대학원생으로 구성되어, 정적 자세를 주로 취하는 VDT 작업자와 유사한 특성을 가진 점을 들 수 있다. 따라서 조립 라인과 같이 근육을 자주 사용하는 피험자에 대한 생체 지표의 경향을 파악할 필요가 있을 것으로 보인다. 해당 결과를 기반으로, 기존에 작업자들의 근육 상태를 평가하기 위해 번거롭게 부착했던 EMG-sensors가 아닌 간단한 test만으로 근육 상태를 평가할 수 있는 MYOVISION의 활용 또한 기대할 수 있을 것으로 보인다.
References
1. Boyd-Clark, L., Briggs, C. and Galea, M., Comparative histochemical composition of muscle fibers in a pre- and a postvertebral muscle of the cervical spine, The Journal of Anatomy, 199(6), 709-716, 2001.
Google Scholar
2. Carter, J.B. and Banister, E.W., Musculoskeletal problems in VDT work: a review, Ergonomics, 37(10), 1623-1648, 1994.
Google Scholar
3. Collaca, C.J. and Hinrichs, R.N., The biomechanical and clinical significance of the lumbar erector spinae flexion-relaxation phenomenon: a review of literature, Journal of Manipulative and Physiological Therapeutics, 28(8), 623-631, 2005.
Google Scholar
4. Coorevits, P., Danneels, L., Cambier, D., Ramon, H. and Vanderstraeten, G., Assessment of the validity of the Biering-Sorensen test for measuring back muscle fatigue based on EMG median frequency characteristics of back and hip muscles, Journal of Electromyography and Kinesiology, 18(6), 997-1005, 2008.
Crossref
Google Scholar
5. Dedering, A., Nemeth, G. and Harms-Ringdahi, K., Correlation between electromyographic spectral changes and subjective assessment of lumbar muscle fatigue in subjects without pain from the lower back, Clinical Biomechanics, 14(2), 103-111, 1999.
Google Scholar
6. Deyo, R.A., Loeser, J.D. and Bigos, S.J., Herniated lumbar intervertebral disk, Annals of Internal Medicine, 112(8), 598-603, 1990.
Crossref
Google Scholar
7. Dolan, P. and Adams, M.A., Repetitive lifting tasks fatigue and back muscles and increase the bending moment acting on the lumbar spine, Journal of Biomechanics, 31(8), 713-721, 1998.
Crossref
Google Scholar
8. Floyd, W.F. and Silver, P.M.S., Function of erectors spinae in flexion of the trunk, The Lancet, 257(6647), 133-134, 1951.
Crossref
Google Scholar
PubMed
9. Geisser, M.E., Haig, A.J., Wallbom, A.S. and Wiggert, E.A., Pain-related fear, lumbar flexion, and dynamic EMG among persons with chronic musculoskeletal low back pain, The Clinical Journal of Pain, 20(2), 61-69, 2004.
Google Scholar
10. Hart, J.M. and Ingersoll, C.D., Quadriceps EMG frequency content following isometric lumbar extension exercise, Journal of Electromyography and Kinesiology, 20(5), 840-844, 2010.
Crossref
Google Scholar
11. Jin, S., Ning, X. and Mirka, G.A., An algorithm for defining the onset and cessation of the flexion-relaxation phenomenon in the low back musculature, Journal of Electromyography and Kinesiology, 22(3), 376-382, 2012.
Crossref
Google Scholar
12. Jin, S. and Mirka, G.A., A systems-level perspective of the biomechanics of the trunk flexion-extension movement: Part II - Fatigued low back conditions, International Journal of Industrial Ergonomics, 46, 1-6, 2015.
Google Scholar
13. Jin, S., Biomechanical characteristics in the recovery phase after low back fatigue in passive and active tissues, International Journal of Industrial Ergonomics, 64, 163-169, 2018.
Google Scholar
14. Jung, H.S., Choi, S.J. and Jang, W.K., Factors affecting the occurrence of low back pain among female workers in manufacturing, The Journal of Korean Community Nursing, 12(2), 504-512, 2001.
Google Scholar
15. Kankaanpaa, M., Taimela, S., Webber, C.L., Airaksinen, O. and Hanninen, O., Lumbar paraspinal muscle fatigability in repetitive isoinertial loading: EMG spectral indices, Borg scale and endurance time, European Journal of Applied Physiology and Occupational Physiology, 76(3), 234-242, 1997.
Google Scholar
16. Kelly, A.M., Does the clinically significant difference in visual analog scale pain scores vary with gender, age, or cause of pain?, Academic Emergency Medicine, 5(11), 1086-1090, 1998.
Google Scholar
17. Kim, D.H., Kim, J.H., Shin, H.R., Chun, J.H., Kim, Y.W., Kim, J.H. and Lee, C.U., Risk factors of work-related low back pain in manufacturing workers, 26(1), 20-36, 1993.
Crossref
Google Scholar
18. Kim, K.S., Park, J.K. and Kim, D.S., Status and characteristics of occurrence of work-related musculoskeletal disorders, Journal of the Ergonomics Society of Korea, 29(4), 405-422, 2010.
Google Scholar
19. Lee, H.R., Evaluation of muscle activity as influenced by shape and arrangement of the EMG electrodes in the musculature of the upper and lower extremities, Korean Journal of Human Ecology, 26(5), 445-457, 2017.
20. Lim, H.S., Chung, M.K., Kim, S.K. and Lee, J.M., A study on the methods evaluation and prevention of occupational low back pain, Korean Occupational Safety and Health Agency, 10-20, 1998.
21. Li, Y., Zhang, X., Dai, J., Wang, J., Wu, H., Liu, J., Chen, J., Zhu, Y. and Zhao, F., Changes in the flexion-relaxation response after percutaneous endoscopic lumbar discectomy in patients with disc herniation, World Neurosurgery, 125, 1042-1049, 2019.
Google Scholar
22. Mannion, A.F., Dumas, G.A., Cooper, R.G., Espinosa, F.J., Faris, M.W. and Stevenson, J.M., Muscle fibre size and type distribution in thoracic and lumbar regions of erector spinae in healthy subjects without low back pain: normal values and sex differences, The Journal of Anatomy, 190(4), 505-513, 1997.
Crossref
Google Scholar
23. Maroufi, N., Ahmadi, A. and Khatir, S.R.M., A comparative investigation of flexion relaxation phenomenon in healthy and chronic neck pain subjects, European Spine Journal, 22(1), 162-168, 2013.
Google Scholar
24. Mayer, J.M., Graves, J.E., Robertson, V.L., Pierra, E.A., Verna, J.L. and Ploutz-Snyder, L.L., Electromyographic activity of the lumbar extensor muscles: effect of angle and hand position during roman chair exercise, Archives of Physical Medicine and Rehabilitation, 80(7), 751-755, 1999.
Crossref
Google Scholar
25. McGill, S.M. and Kippers, V., Transfer of loads between lumbar tissues during the flexion-relaxation phenomenon, Spine, 19(19), 2190-2196, 1994.
Crossref
Google Scholar
26. Neblett, R., Brede, E., Mayer, T.G. and Gatchel, R.J., What is the best surface EMG measure of lumbar flexion-relaxation for distinguishing chronic low back pain patients from pain-free controls?, The Clinical Journal of Pain, 29(4), 334-340, 2013.
Google Scholar
27. Nouwen, A., Akkerveeken, P.F.V. and Versloot, J.M., Patterns of muscular activity during movement in patients with chronic low-back pain, Spine, 12(8), 777-782, 1976.
Crossref
Google Scholar
28. Paoloni, M., Bernetti, A., Fratocchi, G., Mangone, M., Parrinello, L., Cooper, M.D.P., Sesto, L., Sante, L.D.I. and Santilli, V., Kinesio taping applied to lumbar muscles influences clinical and electromyographic characteristics in chronic low back pain patients, European Journal of Physical and Rehabilitation Medicine, 47(2), 237-244, 2011.
Google Scholar
29. Punnett, L. and Wegman, D.H., Work-related musculoskeletal disorders: the epidemiologic evidence and the debate, Journal of Electromyography and Kinesiology, 14(1), 13-23, 2004.
Crossref
Google Scholar
30. Sihoven, T., Partanen, J., Hanninen, O. and Soimakallio, S., Electric behavior of low back muscles during lumbar pelvic rhythm in low back pain patients and healthy controls, Archives of Physical Medicine and Rehabilitation, 72(13), 1080-1087, 1991.
Google Scholar
31. Waddell, G., Volvo award in clinical sciences. A new clinical model for the treatment of low-back pain, Spine, 12(7), 632-644, 1987.
32. Watson, P.J., Booker, C.K., Main, C.J. and Chen, A.C.N, Surface electromyography in the identification of chronic low back pain patients: the development of the flexion relaxation ratio, Clinical Biomechanics, 12(3), 165-171, 1997.
Google Scholar
33. Wolfe, P.J., Fatigue assessments in rheumatoid arthritis: comparative performance of visual analog scales and longer fatigue questionnaires in 7760 patients, The Journal of Rheumatology, 31(10), 1896-1902, 2004.
Crossref
Google Scholar
34. Won, J.I., Cho, S.H., Yi, C.H., Kwon, O,Y., Lee, Y.H. and Park, J.M, Characteristics of the fatigue index in EMG power spectrum analysis during isokinetic exercise, Physical Therapy Korea, 8(3), 11-26, 2001.
Google Scholar
35. Yi, S.J., Kim, K.Y., Cha, S.E., Park, S.R. and Lim, W.S., Low back pain and related factors in men workers for manufacturing industry, The Journal of Korean Society of Physical Therapy, 12(2), 7-15, 2000.
Google Scholar
36. Zabihhosseinian, M., Holmes, M.W.R., Ferguson, B. and Murphy, B., Neck muscle fatigue alters the cervical flexion relaxation ratio in sub-clinical neck pain patients, Clinical Biomechanics, 30(5), 397-404, 2015.
Crossref
Google Scholar
PIDS App ServiceClick here!