eISSN: 2093-8462 http://jesk.or.kr
Open Access, Peer-reviewed
eISSN: 2093-8462 http://jesk.or.kr
Open Access, Peer-reviewed
Dohyung Kee
10.5143/JESK.2017.36.3.255 Epub 2017 June 29
Abstract
Objective: This study aims to survey visual search performance models to assess and predict individual's visual tasks in everyday life and industrial sites.
Background: Visual search is one of the most frequently performed and critical activities in everyday life and works. Visual search performance models are needed when designing or assessing the visual tasks.
Method: This study was mainly based on survey of literatures related to ergonomics relevant journals and web surfing. In the survey, the keywords of visual search, visual search performance, visual search model, etc. were used.
Results: On the basis of the purposes, developing methods and results of the models, this study categorized visual search performance models into six groups: probabilitybased models, SATO models, visual lobe-based models, computer vision models, neutral network-based models and detection time models. Major models by the categories were presented with their advantages and disadvantages. More models adopted the accuracy among two factors of accuracy and speed characterizing visual tasks as dependent variables.
Conclusion: This study reviewed and summarized various visual search performance models.
Application: The results would be used as a reference or tool when assessing the visual tasks.
Keywords
Visual task Visual search Visual search performance
Visual search is one of the most frequently performed activities in everyday life and works such as locating car keys on a cluttered desk, airport baggage screeners, industrial inspection, military vigilance task, etc. For example, visual search constitutes 90% of diverse aircraft inspections tasks (Drury et al., 1990). The visual search is defined by the process of finding target items among non-relevant distractor stimuli (Avraham et al., 2008; Biggs et al., 2013). The visual search is critical for tasks of everyday and beyond it, including driving cars, military environments and many medical situations like inspection of radiographic images. Allowing a faulty or nonconforming product into the marketplace or missing an important target in driving, military or medical systems can lead to serious consequences. Approximately 18% of the wide-body aircraft accidents in the late 1980s were a consequence of maintenance and inspection errors, the majority of which were attributed to inspection (Melloy et al., 2000). Thus, it is very important that visual detection is performed well (Yu and Chan, 2013).
Many studies on visual search have focused on determining visual factors such as differences between targets and nontargets, nontarget density, distribution of nontarget stimuli, size of search area, axis inclination (meridian), peripheral stimulus position, target orientation, cuing, age, blur interpretation ability, physical stressors including high luminance and hypoxia, etc., and their effects on visual search performance (Kee et al., 1992). Here, visual search performance is expressed in terms of detection time, target detection probability, number of errors took place in visual tasks, etc.
Some research have been conducted on developing and evaluating visual search performance models for predicting the accuracy or speed of visual tasks. The models can be used as a valuable tool or reference when designing or assessing visual tasks or visual displays such as VDT (visual display terminal). For better designing or assessing visual tasks, information on what models exist, and the contents, advantages and disadvantages of the models is needed. Therefore, this study aims to survey visual search performance models dealt with in the studies conducted up to now.
This study was conducted mainly based on survey of literatures through surfing webpages of ScienceDirect and Google, and ergonomics relevant journals including Applied Ergonomics, Ergonomics, Human factors, International Journal of Industrial Ergonomics, Perceptual and Motor Skill, Theoretical Issues in Ergonomics Science, Vision Research. The key words of visual search, visual search performance model, visual search model, etc. were used in the survey. The literatures listed in the references of the manuscripts found by the web browsing were also surveyed.
The visual search performance models or relevant studies surveyed in this study were varying and classified into several different ways. On the basis of their purposes, developing methods and final results, the models were grouped into six categories: probability-based models, SATO (speed accuracy trade-off) models, visual lobe-based models, models for computer vision, neutral network-based models, detection time models including isoresponse time region and fuzzy linear regression model. The models were summarized by the categories in the following.
3.1 Probability-based models
Krendel and Wodinsky (1960) proposed the cumulative probability of detection F(t) of random search for a single-target task, which is as follows:
where is the probability that a target can be detected in a single glimpse, T is the sum of the fixation
time and the movement time of the eyes, and n is the number of independent glimpses used to detect the target.
Here, the random search is one of two types of visual search strategies: systematic search and random search. In systematic search, the fixations composing the search are treated as sampling from the search field without replacement; that is, the (i)th fixation is constrained to fall only on an area not fixated in the preceding (i - 1) fixations. Random search is sampling with replacement in that a previously fixated area is as likely to be refixated as any other area (Arani et al., 1984).
Morawski et al. (1980) expanded the above model by adopting the concept of the visual lobe.
where A is the field area that is searched, α is the visual lobe size, is the probability that a target will be detected in a single
glimpse, and T is the duration of individual fixations.
The visual lobe is defined by the area which surrounds the fixation point and can be perceived in a single glimpse or fixation (Yu and Chan, 2013; Morawski et al., 1992).
Based on the above single-target model, a random visual search model for multiple targets was derived by Drury and Hong (2000):
where all of the targets (n) have identical λ, i is the order of the target detected, and is the cumulative search time distribution
for the i th target.
As seen in the model, it was assumed that the search times for the targets are mutually independent, which means that the search times for the found targets will not affect those for the later targets. Irrespective of two targets having identical or different difficulty, Chan and Chan (2000), and Chan and Yu (2010) showed that while for the first targets, there was no difference between the search times obtained experimentally and those by the model, for the second targets, the search times obtained experimentally were shorter than the theoretical times by the model.
Yu and Chan (2013) conducted an experiment on a visual search task having three targets with identical difficulty levels, and confirmed the mean search times for the second and third targets were shorter than the theoretical search times. They proposed an improved random visual search model for multiple targets by using the data obtained in the experiment. The model was expressed as follows:
where b is constant of field reduction according to the sequence of target detection, n is the number of targets and is the
response time.
While the above model was improved compared to the previous model and can be applied to multiple-target visual search tasks, the exact parameters needed for a specific multiple target task will have to be obtained by consideration of the task situation and the effects of differences in stimulus factors (e.g., target and background character, density, display method) and task factors (e.g., illumination, contrast) (Yu and Chan, 2013).
3.2 SATO models
Speed and accuracy characterize the performance of visual search tasks. Speed refers to the time required to complete the task, whereas accuracy is related to the number of defects detected. These two measures are inversely related; that is, accuracy generally decreases as speed increases and vice versa (Melloy et al., 2000). This relationship between speed and accuracy is commonly referred to as the speed accuracy trade-off (SATO) (Drury, 1994).
Several different models have been developed previously to investigate the SATO (e.g., Arani et al., 1984; Drury and Chi, 1995; Karwan et al., 1995; Morawski et al., 1980, 1992). Morawski et al. (1980) proposed equations of the cumulative probability of locating targets in a given time(t)(F(t)) for single and multiple faults for random search and systematic search. Although the models reproduce well the cumulative search time distribution, F(t), neither fully accords with eye movement data. Arani et al. (1984) provided a new model in which search is intended to be systematic but suffers from imperfect memory. Systematic search is then a special case in which the memory is perfect, and random search is a special case in which the memory is totally lacking. The model was derived for single and multiple occurrences of a single fault (or target) type.
Under the assumption that the human operator maximizes an objective function, subject to given constraints, some optimization models were developed by Morawski et al. (1992), Karwan et al. (1995) and Drury and Chi (1995). An obvious search model is to maximize some value function (e.g. expected payoff to the inspector) over the stopping time (ts) with the SATO as a constraint:
Maximize EV() = max(
){EV(
)}
Subject to {SATO}
Based on this approach, Drury and Chi (1995) derived four models for visual inspection: random and systematic searches for single fault and two faults, which were similar to the models proposed by Morawski et al. (1992) and Karwan et al. (1995). The four models assumed that the task was self-paced, i.e., the inspector can move on the next item as soon as a decision has been reached on the current item. Outcomes and probabilities according to the number of faults and search strategy are summarized in Table 1. Through two experiments in which ten participants were instructed to inspect printed circuit board for one or two faults under different defective rates and cost structures, Drury and Chi (1995) validated not only their optimization models, but also the modelling approaches to define the SATO by Morawski et al. (1980).
|
|
Outcome |
Probability |
|
|
Random search |
Systematic search |
||
|
Single fault |
Item is faulty, fault is detected |
|
|
|
Item is faulty, fault is missed |
|
|
|
|
Item is good |
|
|
|
|
Two fault types |
Item is faulty, fault a is present, |
|
|
|
Item is faulty, fault a is present, |
|
|
|
|
Two fault types |
Item is faulty, fault b is present, |
|
|
|
Item is faulty, fault b is present, |
|
|
|
|
Item is good |
|
|
|
The above models, however, were designed for two situations: (1) situations in which only one defect of a specific type could occur (e.g., Drury and Chi, 1995; Morawski et al., 1992), or (2) situations wherein multiple defects could occur, but with the stipulation that the search would terminate when one or more defects are detected (e.g., Arani et al., 1984; Morawski et al., 1980). Moreover in these instances, an item is ordinarily classified as "defective" if even one defect is detected in the search field. Consequently, search accuracy has traditionally been defined as the proportion of defective items that are discovered (Melloy et al., 2000).
To overcome the problems of the existing models, Harris et al. (1998) designed the models for situations in which the objective is to locate as many defects as possible on a part, within a specified period of time. These models were exclusively developed for systematic and random searches. The performance measure of interest is accuracy, where accuracy is defined as the proportion of defects that are detected in a particular search field within a specified period of time (or equivalently, a given number of fixations). Since accuracy is a random variable, the expected value (mean) of the accuracy was employed as the actual measure of search performance (Melloy et al., 2000). The mean of the search accuracy for a defect of type t is
where n is the number of fixations, and c is number of distinct cells that comprises the search field.
Melloy et al. (2000) used visual search tasks of aircraft inspection to examine the trade-off between speed and accuracy, and showed that (1) the men accuracy is directly related to the number of fixations and (2) the men accuracy is inversely related to the number of cells in the search field in the case of strictly random behavior.
3.3 Visual lobe-based models
Drury (1992) suggested that the search time for a given search area depends on the three major factors such as the lobe size, the fixation time and the search strategy. Johnston (1965) showed that the size of the visual lobe had a significant effect on search performance. In other words, the subjects who had larger visual lobes exhibited shorter search times (Gramopadhye et al., 2002).
Engel (1977) developed a visual lobe-based equation to estimate the mean time of finding a target in a visual task:
where is mean search time,
is duration of individual fixations (often assumed to be 300ms), A is area of the field (or sheet)
being searched, a is area around the line of sight in which the target can be detected in
seconds i.e., lobe size, and
is
probability of detecting a target if it falls within 'a'.
Based on the above model and a series of visual lobe size experiments, Gallwey (2009) introduced linear regression equation of the visual lobe-based model:
Mean search time = 19.8331 x log() + 1.6346 (r = 0.7952)
where is effective target detection probability.
Here, is inversely related to the diameter of the effective lobe size (
). If the values of
and
are given, the value
can be calculated based on the above equation. The value of
is obtained by using the equations provided by Gallwey (2009).
The
was derived from experimental data, which is as follows:
On the contrary to the above models, Chan and Courtney (1993) pointed out that on the basis of experimental data for a competitive search task with 18 subjects, none of the visual dimensions was found to correlate significantly with average search time nor with eye movement parameters.
3.4 Computer vision models
Up to now, varying computational models have been presented to account for search performance (Avraham et al., 2008). The temporal-serial model suggests that when the exposure time is limited, the observer can process only k out of the n stimuli present in the display. If the target is one of the k selected stimuli in a target-present display, a correct decision is made. Otherwise, a guess would yield 50% success (Bergen and Julesz, 1983). This model is consistent with serial search models in which the items are searched in random order (e.g., Treisman and Gelade, 1980). The SDT models assume that the stimuli are observed with stochastic noise. According to this view, a false detection may occur when one of the distractors in a noisy observation is mistakenly perceived as a target (i.e., as belonging to the target distribution), and a miss may occur when the target is mistakenly perceived as a distractor. Hence, the chances of such detection errors increase with an increase in the number of search items and with an increase in target-distractor similarity. Duncan and Humphreys (1989) proposed similarity theory, in which attention is not drawn to locations but rather to image objects, and search efficiency depends on similarities between objects in the scene and possible targets (target-distractor similarity) and between objects within the scene (distractor heterogeneity). Specifically, search efficiency deteriorates as target-distractor similarity and distractor heterogeneity increase.
Rosenholtz (1999) has developed a simple measure for a target's saliency that reflects search efficiency (denoted the saliency measure) and implemented it within the best-normal model (Rosenholtz, 2001). While the saliency measure is a qualitative abstract mathematical phrase for search task difficulty, the best-normal model is quantitative. The best-normal model is a variation of SDT models. While SDT models assume the observer keeps a record of the exact distribution of the distractors, the best-normal model suggests that during visual search the observer uses a simpler approximated representation of distractor distribution. The true distribution is represented only by its mean and variance, that is, by the normal distribution that best fits the distractors' true distribution.
The RCref model is another variation of SDT models (relative coding-with-reference; Rosenholtz, 2001), which is a modification of the relative coding model (Palmer et al., 2000). Like the best-normal model, the RCref model suggests that the observer does not use the exact distribution of the search items. The recorded distribution does not correspond to the feature values themselves but to the relative values. Specifically, the recorded distribution corresponds to the combination of differences between the various items in the display and the differences between the display items and a reference target. Thus, to decide whether an observed display item is a target or a distractor, it is sometimes compared to another display item and sometimes to a reference target.
Avraham and Lindenbaum (2005, 2006) developed the cover difficulty measure and the FLNN algorithm for visual search in the context of automated computerized systems for object recognition and detection. The cover is a measure that allows us to qualitatively predict the relative difficulty of different search tasks. As it was originally developed for computer vision, it was assumed that there is no difference between the displayed items and the observed input (i.e., there is no internal noise). The cover is calculated as follows: First, the smallest difference between the target's feature value and a distractor's feature value is measured and denoted dT. Then, the cover measure is the number of segments of length dT required to cover all the points representing the distractors in the feature space.
The cover measure suggests a way to compare different search conditions. The relation between the cover measure and the observer accuracy is not explicit, however. The cover measure and human performance may be linked by modeling the search using a simple mechanism, denoted FLNN (farthest-labeled nearest neighbor), developed for computerized visual-search tasks (Avraham and Lindenbaum, 2005, 2006). The FLNN algorithm starts by choosing one of the display items randomly. If the currently selected item is not the target, another item is selected. This would be the item that is farthest (feature-wise) from all previously selected items. This procedure is repeated until the target is found.
Avraham et al. (2008) conducted four experiments in which target-distractor similarity and distractor heterogeneity were systematically manipulated, in order (1) to test the relevance of the cover measure and the FLNN model to human search performance, and (2) to compare their predictive ability to that of other prominent quantitative models of visual search, including the saliency measure, the standard SDT model, the best-normal model, the RCref model, and the temporal-serial model. The results showed that the cover measure and the FLNN model were applicable to human search performance and predicted the participants' performance better than the models to which they were compared.
3.5 Neural network-based models
Kazanovich and Borisyuk (2012) presented an oscillatory neural network model that can account for reaction times in visual
search experiments. The model consists of a central oscillator that represents the central executive of the attention system and a
number of peripheral oscillators that represent objects in the display. Computer simulations showed that the model can reproduce
reaction times in visual search tasks of various complexities. All models provided in the study are a good fit to the data (
ranges from 0.56 to 0.99).
There were a few studies trying to explain individual performance variability in visual search by using brain activities of EEG data (Berg et al., 2016; Milne et al., 2013).
3.6 Detection time models
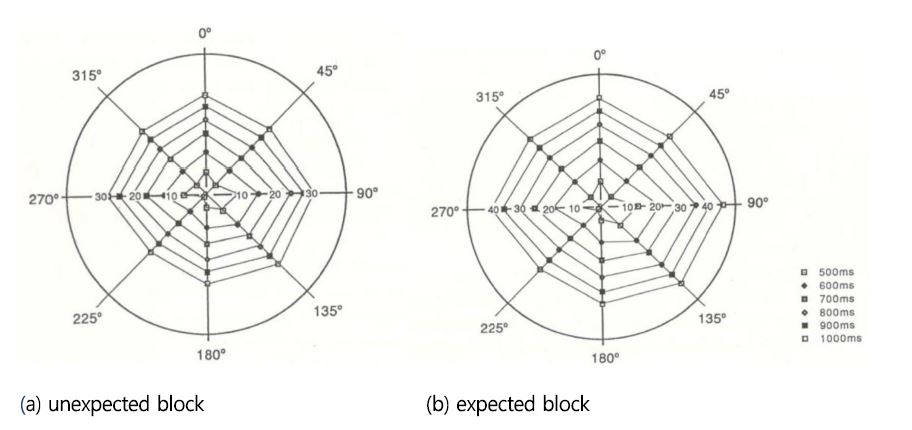
Haines (1973) investigated response time in the full visual field for 72 locations on nine peripheral positions and eight meridians, which provided two linear least squares fits per meridian. The grand mean data were replotted from these curves as isoresponse time regions within visual field, each boundary indicating the region within which mean response time was expected to be the same. In addition to the peripheral position and meridian considered in the isoresponse time region by Haines (1973), there are many background conditions of visual tasks affecting response time, including non-target density, size of display, color, shape, size and contrast of stimuli, etc. (Kee et al., 1992). Reflecting these facts, Kee et al. (1992) conducted an experiment of visual search task with considering background conditions of field heterogeneity, target uncertainty, density, size contrast, peripheral position, meridian and expectancy. More realistic isoresponse time region was proposed on the basis of the experimental data. Two types of isoresponse time regions were presented depending upon target expectancy: expected block, which informed the subject of the target location and unexpected block, which did not inform the subject of the target location (Figure 1).
The above isoresponse time regions supply only crisp data on whether a target can be seen in a predetermined time. In real situations, the possibility that the response to a target can be made in a certain amount of time is more useful than the crisp data. For doing this, Kee et al. (1992) adopted fuzzy linear regression (FLR) model. In a normal regression model, deviations between the observed values and the estimated values are supposed to be due to measurement errors, but in the FLR model, these deviations are assumed to depend on the fuzziness of the parameters of the system structure. The FLR is defined as follows:
where the fuzzy parameters A = (, …,
) are denoted in the vector form of A = [α, c], α = (
, …,
)
, c = (
, …,
), αi is
the center of membership function of
independent variable, and
is the width of membership function of
independent
variable.
The fuzzy parameters in a form of triangular membership functions are most frequently used. The FLR is solved by the general linear programming technique. If a value of possibility is given, the lower and upper bound of the estimated response times can be obtained by the formula of triangular membership function. In addition, if the time allowed for any visual task is given, the value of possibility can be obtained.
This study reviewed and summarized visual search performance models through literature survey and web surfing. Based on their purposes, developing methods and final results, varying models surveyed in this study were classified into six categories including probability-based models, SATO models, visual lobe-based models, computer vision models, neutral network-based models and detection time models. More models adopted the accuracy expressed by probability as final outputs or dependent variables rather than the function of speed such as detection time. Traditional studies of probability-based and visual lobe-based models, and SATO models provided equations according to the number of targets and search strategy. However, most models of the studies were limited to visual tasks with two or less targets, which implies that there is no visual search performance model applicable to general visual situations.
It should be noted that many computerized visual models haven been developed recently with reflecting increased usage of machine vision in everyday life and industrial settings, and that the models were proved to be applicable to human search performance. It was also found that the neural network was adopted to more accurately predict reaction times in visual tasks, and that bio-data of EEG were used to account for intra-subject's variability in visual tasks. This means that more precise visual search performance can be developed through combining the neural network and bio-data in the near future.
References
1. Arani, T., Karwan, M.H. and Drury, C.G., A variable-memory model of visual search, Human Factors, 26, 631-639, 1984.
Crossref
Google Scholar
PubMed
2. Avraham, T. and Lindenbaum, M.,
Crossref
Google Scholar
3. Avraham, T. and Lindenbaum, M., Attention-based dynamic visual search using inner-scene similarity: Algorithms and bounds, IEEE Transactions on Pattern Analysis and Machine Intelligence, 28, 251-264, 2006.
Crossref
Google Scholar
4. Avraham, T., Yeshurun, Y. and Lindenbaum, M., Predicting visual search performance by quantifying stimuli similarities, Journal of Vision, 8(4), 1-22, 2008.
Crossref
Google Scholar
PubMed
5. Berg, B. v.d., Applebaum, L.G., Clark, K., Lorist, M.M. and Woldorff, M.G., Visual search performance is predicted by both prestimulus and poststimulus electrical brain activity, Scientific Reports (Open Journal), 6, 1-13, 2016.
Crossref
Google Scholar
6. Bergen, J.R. and Julesz, B., Rapid discrimination of visual patterns, IEEE Transactions on Systems, Man and Cybernetics, 13, 857- 863, 1983.
Crossref
Google Scholar
7. Biggs, A.T., Cain, M.S., Clark, K., Darling, E.F. and Mitroff, S.R., Assessing visual search performance differences between transportation security administration officers and nonprofessional visual searchers, Visual Cognition, 21(3), 330-352, 2013.
Crossref
Google Scholar
8. Chan, A.H.S. and Chan, C.Y., Validating the random search model for a double target search task, Theoretical Issues in Ergonomics Science, 1(2), 157-167, 2000.
Crossref
Google Scholar
9. Chan, A.H.S. and Courtney, A.J., Inter-relationships between visual lobe dimensions, search times and eye movement parameters for a competition search task, Annals of Physiological Anthropology, 12(4), 219-227, 1993.
Crossref
Google Scholar
10. Chan, A.H.S. and Yu, R., Validating the random search model for two targets of different difficulty, Perceptual and Motor Skill, 110(1), 167-180, 2010.
Crossref
Google Scholar
PubMed
11. Drury, C.G., Inspection Performance/ In: G. Salvendy(Ed), Handbook of Industrial Engineering, 2nd Edition, Wiley, New York, 1992.
Crossref
12. Drury, C.G., The speed accuracy tradeoff in industry, Ergonomics, 37(4), 747-763, 1994.
Crossref
Google Scholar
13. Drury, C.G. and Hong, S.K., Generalizing from single target search to multiple target search, Theoretical Issues in Ergonomics Science, 1(4), 303-314, 2000.
Crossref
Google Scholar
14. Drury, C.G. and Chi, C-F., A test of economic models of stopping policy in visual search, IIE Transactions, 27, 382-393, 1995.
Crossref
Google Scholar
15. Drury, C.G., Prabhu, P. and Gramopadhye, A.,
Crossref
Google Scholar
16. Duncan, J. and Humphreys, G.W., Visual search and stimulus similarity, Psychological Review, 96, 433-458, 1989.
Crossref
Google Scholar
PubMed
17. Engel, F.L., Visual conspicuity, visual search and fixation tendencies of the eye, Vision Research, 17, 95-108, 1977.
Crossref
Google Scholar
PubMed
18. Gallwey, T.J., Lobe size for several targets and their effect on visual search time, International Journal of Industrial Ergonomics, 39, 601-607, 2009.
Crossref
Google Scholar
19. Gramopadhye, A.K., Drury, C.G., Jiamg, X. and Sreenivasan, R., Visual search and visual lobe size: can training on one affect the other?, International Journal of Industrial Ergonomics, 30, 181-195, 2002.
Crossref
Google Scholar
20. Haines, R.F., Response time in the full visual field, Journal of Applied Psychology, 58, 289-295, 1973.
Crossref
Google Scholar
21. Harris, J.M., Melloy, B.J. and Gramopadhye, A.K., The accuracy of inspectors in time-terminated visual searches, Working Paper 97-102, Department of Industrial Engineering, Clemson University, 1998.
Crossref
22. Johnston, D.M., Search performance as a function of peripheral acuity, Human Factors, 7, 528-535, 1965.
Crossref
Google Scholar
PubMed
23. Karwan, M.H., Morawski, T.B. and Drury, C.G., Optimum speed of visual inspection using a systematic search strategy, IIE Transactions, 27, 291-299, 1995.
Crossref
Google Scholar
24. Kazanovich, Y. and Borisyuk, R., Reaction times in visual search can be explained by a simple model of neural synchronization, Neural Networks, 87, 1-7, 2012.
Crossref
Google Scholar
25. Kee, D., Jung, E. and Chung, M.K., Isoresponse time regions for the evaluation of visual search performance in ergonomic interface models, Ergonomics, 35(3), 243-252, 1992.
Crossref
Google Scholar
26. Krendel, E.S. and Wodinsky, J., Search in an unstructured visual field, Journal of the Optical Society of America, 50(6), 562-568, 1960.
Crossref
Google Scholar
27. Melloy, B.J., Harris, J.M. and Gramopadhye, A.K., Predicting the accuracy of visual search performance in the structural inspection of aircraft, International Journal of Industrial Ergonomics, 25, 277-283, 2000.
Crossref
Google Scholar
28. Milne, E., Dunn, S.A., Freeth, M. and Rosas-Martinez, L., Visual search performance is predicted by the degree to which selective attention to features modulates the ERP between 350 and 600ms, Neuropsychologia, 51, 1109-1118, 2013.
Crossref
Google Scholar
29. Morawski, T.B., Drury, C.G. and Karwan, M.H., Predicting search performance for multiple targets, Human Factors, 22(6), 707-719, 1980.
Crossref
Google Scholar
PubMed
30. Morawski, T.B., Drury, C.G. and Karwan, M.H., The optimum speed of visual Inspection using a random search strategy, IIE Transactions, 24(5), 122-133, 1992.
Crossref
Google Scholar
31. Palmer, J., Verghese, P. and Pavel, M., The psychophysics of visual search, Vision Research, 40, 1227-1268, 2000.
Crossref
Google Scholar
PubMed
32. Rosenholtz, R., A simple model predicts a number of motion popout phenomena, Vision Research, 39, 3157-3163, 1999.
Crossref
Google Scholar
PubMed
33. Rosenholtz, R., Search asymmetries? What search asymmetries? Perception & Psychophysics, 63, 476-489, 2001.
Crossref
Google Scholar
34. Treisman, A.M. and Gelade, G., A feature integration theory of attention, Cognitive Psychology, 12, 97-136, 1980.
Crossref
Google Scholar
35. Yu, R. and Chan, A.H.S., Visual search time in detection tasks with multiple targets: Considering change of the effective stimulus field area, International Journal of Industrial Ergonomics, 43, 328-334, 2013.
Crossref
Google Scholar
PIDS App ServiceClick here!