eISSN: 2093-8462 http://jesk.or.kr
Open Access, Peer-reviewed
eISSN: 2093-8462 http://jesk.or.kr
Open Access, Peer-reviewed
Seul Chan Lee
, Sol Hee Yoon
, Yong Gu Ji
10.5143/JESK.2020.39.6.597 Epub 2021 January 04
Abstract
Objective: This study investigated the effects of design variables in in-vehicle touch user interfaces in terms of driving performance, glance behavior, and subjective workload.
Background: Touch user interfaces are commonly used as in-vehicle information systems (IVISs). However, touchscreen design variables that may affect driver behavior have not been thoroughly investigated.
Method: We conducted a driving simulation experiment involving an item searching task and a menu task. Each task included two design variables (item searching task: item numbers per screen and presentation format; hierarchical menu task: menu type and menu orientation consistency).
Results: The results showed that the number of items per screen and menu orientation consistency have significant effects on driver behavior, whereas the presentation format and menu type exhibit no significant effects. By analyzing the differences in the drivers' age, we found that the effects of independent variables vary by age.
Conclusion: Based on the results of this study, the following conclusions and recommendations are proposed for the design of an in-vehicle touch interface: 1) When designing menus or lists for applying a touch task while driving, it is recommended that the number of items per screen be eight or less to reduce its impact on the driver behavior, 2) When designing a menu, the orientation of each menu level should be unified so that there is no negative influence of disorientation, and 3) When the menu structure has a simple structure, differences in the menu structure (whether expandable or sequential) have a weak effect on the driving behaviors. However, if the complexity of the information structure required by the task increases, it is necessary to be cautious about making an approach based on this conclusion.
Application: The findings in this study can provide insight into the design of a touchscreen-based IVIS when considering driving safety.
Keywords
Touch user interface In-vehicle information systems (IVIS) Driver distraction
An in-vehicle information system (IVIS) incorporates secondary functions and presents driving-related information (Harvey and Stanton, 2013). Whereas traditional IVIS user interfaces separately employ hard controllers and information displays, many vehicle manufacturers have recently adopted a touch user interface (Fleming, 2010; Kim et al., 2014b). This trend reflects an advantage of the touch user interface, which facilitates input and output interactions that are simultaneously conducted using the same display area (Scott and Conzola, 1997; Sears et al., 1992); making the interface more intuitive and aesthetically pleasing (Fleischmann, 2007).
However, several studies have raised concerns associated with increased driver distraction when a touch interface is employed instead of a physical controller interface (Crandall and Chaparro, 2012; Reimer et al., 2012). To address such issues, numerous studies have investigated touch interface design factors such as the button size (Feng et al., 2017; Kim et al., 2014a; Tao et al., 2018), button gap (Tao et al., 2018), touch gestures (Colley et al., 2015; Kim et al., 2014b; Swette et al., 2013), and scrolling style (Kujala and Saariluoma, 2011; Large et al., 2013). Although these prior studies have contributed meaningful findings related to those factors affecting a touch input behavior, they have not considered the comprehensive visual-manual interaction associated with the type of tasks that are most frequently conducted through a touch IVIS, including item searching and menu tasks. Therefore, the effects of the design variables related to such tasks must be investigated.
An item searching task involves finding the target item from among other distracting items (e.g., finding a target song), whereas a menu task involves selecting the target menu within a hierarchical information structure. The greatest difference between these two tasks depends on the structure of the information. Whereas all types of information in an item searching task are at the same level, menu tasks comprise information with different hierarchal levels. This prompted us to consider different design variables for each task.
For an item searching task such as music browsing, the number of items per screen and the presentation format are factors influencing the performance of the task. Several studies have provided insight into designing the number of target search items (Feng et al., 2017; Hong et al., 2010; Kujala and Salvucci, 2015; Large et al., 2017; Lasch and Kujala, 2012; Lee et al., 2019b; Li et al., 2017). Feng et al. (2017) and Large et al. (2017) investigated the optimum numbers when drivers conduct a pointing task. The authors found that an increase in the number of items generally has a negative effect on driver behavior. In addition, Kujala and Salvucci (2015) developed a cognitive model of a visual sampling strategy of drivers conducting visual search tasks while driving. Their model predicts that, as the number of items increases, it becomes increasingly difficult for drivers to remember where they searched and when they should turn their attention back to driving owing to a time limitation. However, these studies have also indicated that, although a larger number of items makes it difficult for drivers to find the target, because we need to consider the switching cost, it cannot be concluded that fewer items is better. In fact, several studies have found that the number of items is not a significant factor for an item searching task (Lasch and Kujala, 2012).
The presentation format (or information format) involves the manner through which information is organized and presented. In this study, we focused on different orientations for presenting items in horizontal or vertical formats. Visual search strategies in different presentation formats have been a traditional issue in the field of human-computer interaction; however, few studies have been conducted on the effects of presentation formats in terms of driver behavior. Although some studies have suggested that a driver's vertical eye movements are more demanding compared to their horizontal eye movements, no definitive conclusions can be drawn (Dukic et al., 2005, 2006).
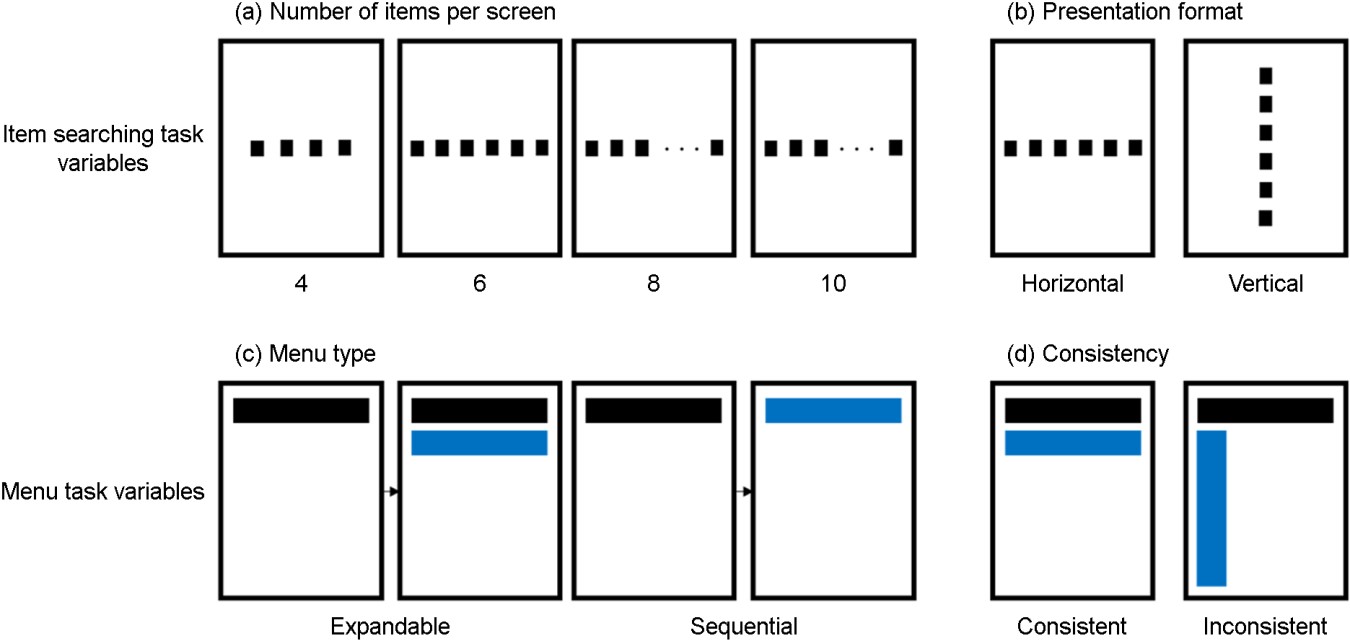
Menu-based user interfaces have been widely employed in an IVIS; however, their design in a driving context remains a challenge. We focused on the design variables to present each level of the menu, including the menu type and menu orientation consistency. Owing to the size limitations of touchscreens used in vehicles, it is not possible to present all levels of the menu information. Therefore, some menus present upper and lower-level menus in an expandable manner, whereas others do not show the upper level menus when the lower-level menus are selected. In addition, the directions through which the upper and lower menus are presented coincide (e.g., horizontal-horizontal) or do not coincide (e.g., horizontal-vertical) with each other, presenting a proper way to efficiently display information depending on the screen orientation or ratio. To the best of our knowledge, a study by Li et al. (2017) has almost exclusively provided meaningful results with regard to the effects of the menu type. They compared two menu layouts, namely, checkboard and hierarchical layouts, in a real driving context. The results showed that the hierarchical menu is superior to the checkboard menu in the stop, 30, and 60km/h driving conditions; however, the checkboard menu exhibited a better performance under 80 km/h driving conditions. Figure 1 shows each variable for the item searching and menu tasks.
To summarize, whether these design variables, namely, the number of items per screen and the presentation format for an item searching task, the menu type, and the orientation consistency for a menu task, are ergonomically appropriate is unclear. Therefore, this study investigated the effects of these design variables on driving performance, glance behavior, usability, and subjective workload in a simulated driving context. To achieve our objective, we designed and executed a driving simulator study using an item searching task and a menu task on a touch interface. Data on the driving performance, glance behavior, and subjective workload were collected to analyze the driver behaviors. Based on the results, this study provides insight useful for the design of a touch user interface applied in an IVIS.
2.1 Experimental design
2.1.1 Independent variables
As previously mentioned, an item searching task and a menu task were selected as touch interaction tasks. Two respective design variables were considered for designing the two tasks.
The item searching task includes the number of items per screen (4, 6, 8, or 10) and the presentation format (horizontal or vertical) as independent variables. The four levels of the number of items per screen were chosen according to the common number found in an IVIS used in commercial vehicles. The menu task includes the menu type (expandable or sequential) and menu orientation consistency (consistent or inconsistent). The expandable menu refers to the simultaneous presentation of the upper- and lower-level menu items on the information display in an extended manner. The sequential menu, by contrast, refers to the presentation of menu items of the current level and not that of the previous level (Kurniawan et al., 2002; Zaphiris et al., 2002). Menu orientation consistency refers to the matching of the orientation between the upper- and lower-level menu items. The two design variables include two levels each; however, the combination of sequential and inconsistent types was excluded from the experimental conditions because it exhibits a very rare structure of an IVIS used in a commercial vehicle. Therefore, the menu task was applied with three levels: 1) expandable + consistent, 2) expandable + inconsistent, and 3) sequential + consistent.
Because many studies have indicated that the driver's age is an important factor that must be considered when examining the effects of IVIS tasks in terms of driving behavior, the driver age was also considered an independent variable (Dukic et al., 2006; Horberry et al., 2006; Oh et al., 2016). The national highway traffic safety administration (NHTSA) recommended including four age groups (18~24, 25~39, 40~54, and 55+ years) when examining the effects of an IVIS on drivers (National Highway Traffic Safety Administration, 2012). Under this classification, drivers aged 23 through 39 years were considered the younger group, whereas those aged 40 through 59 years were considered the older group.
We therefore adopted 4 × 2 × 2 mixed design with the number of items per screen (4, 6, 8, or 10) as a within-subject factor, the presentation format (horizontal or vertical) as a within-subject factor, and age (younger or older) as a between-subject factor for the item searching task. For the menu task, we adopted a 3 × 2 mixed design with different menus (expandable + consistent, expandable + inconsistent, or sequential + consistent) as a within-subject variable and age (younger or older) as a between-subject variable.
2.1.2 Dependent variables
We collected the driving performance, glance behavior, usability, and subjective workload measures, which are widely used for investigating drivers' behavior in previous literature (Feng et al., 2017; Lee et al., 2019a; Peng et al., 2014). Table 1 shows descriptions of measures we collected.
|
|
Measures |
Description |
|
Driving |
Standard deviation of headway distance (SDHD) |
Speed control task performance Variability
of distance to lead vehicle |
|
Standard deviation of lateral position (SDLP) |
Lateral
control task performance Variability
of distance to center position of the lane |
|
|
Glance |
Average eye-off-road time (AEORT) |
Average
duration time of each glance to the touchscreen area for performing IVIS tasks |
|
Total eye-off road time (TEORT) |
Total
glance duration time of all glances away from the front driving context |
|
|
Usability |
Task completion time (TCT) |
Total time for
performing an IVIS task |
|
Number of misses |
The
number of trials that participants miss the target when it is presented on
the screen |
|
|
Subjective |
Driving activity load index
(DALI) |
Subjective
workload evaluation Six
factors: effort of attention, visual demand, auditory demand, temporal
demand, interference, and situational stress 6-point
Likert scale (1: low, 6: high) Adapted
from Pauzie (2008) |
2.2 Tasks
2.2.1 Driving task and scenario
The car-following and lane-keeping tasks were considered the primary tasks, which are mostly used for driving task. The participants were required to maintain a constant distance from the lead vehicle, the speed of which was fixed at 90km/h, and to remain in the center position of the lane without changing lane position. A straight four-lane expressway was used. In the lane in which the driver was driving, no other vehicles except the lead vehicle appeared. In the other lanes, vehicles appeared at intervals of approximately 300m with a constant speed of 60km/h. IVIS tasks were presented after approximately 30s from the start of the driving scenario.
2.2.2 Secondary IVIS task
Item searching task
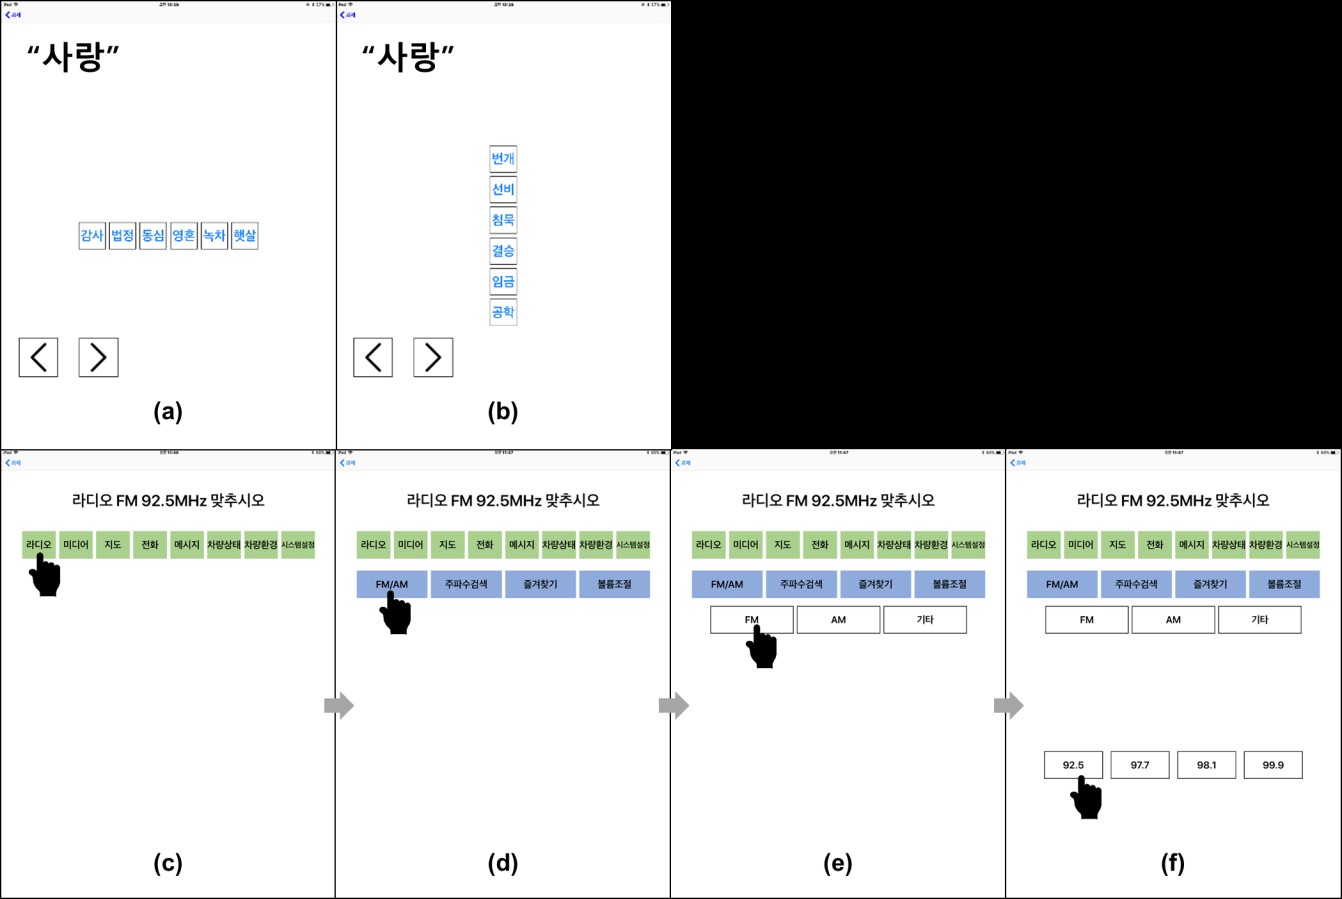
The item searching task involved finding a target word, for instance, when browsing for the title of a song. The target icon and distractor icons were presented in the form of a list on a tablet PC. On the task screen page, the target word was provided at the top-left position on the screen. If the target icon was not present in the list on the current page, the participants were able to turn the page and continue searching. If they found the target and tapped on it, all items on the screen disappeared. Two seconds after completing the task, a new task appeared. A beeping sound was used to notify the participant that a new task had begun. The participants were not required to perform the task quickly and were instructed to do so at their own pace. Under all eight conditions (4 item numbers per screen × 2 presentation formats), the participants performed the item searching task ten times. Half of the participants first conducted the task under a horizontal condition, whereas the other half performed it under a vertical condition. The order of the items numbers per screen was randomly suggested from among the four conditions. To minimize the effects of the target location, the target icon randomly appeared among the 3rd, 7th, 11th, 15th, 19th, 23rd, 27th, 31st, 35th, and 39th positions. For example, as shown in Figure 2 (a, b), for the six-item conditions, the participants were required to find the target word ("love" in Korean) in the horizontal and vertical directions. However, because the target word did not appear on this page, the participants were required to continue searching after moving on to the next page using the arrow buttons.
Menu task
The menu task was designed to test different menu styles. The participants conducted eight tasks involving general functions found in all types of modern vehicles: 1) select an FM/AM radio frequency, 2) adjust the radio volume, 3) play a video, 4) select a target address, 5) call a friend from a phone book, 6) check a message, 7) control the temperature, and 8) change the air-circulation mode. Although the menu button did not actually enable the function, the participants explored the menu hierarchy to apply the target task. The information menu hierarchy used in the experiment was developed by referring to the information structure of recent vehicles. When a new task was presented, the participants were notified through a beeping sound. The participants were not required to perform the task quickly, and were instructed to execute the task at their own pace while driving safely. Once one task was completed, a new task was provided after 2s. Under all three conditions (expandable + consistent, expandable + inconsistent, and sequential + consistent), the participants performed the eight tasks described above. The order of the three conditions was balanced across all participants, and the order of each task was suggested in a predefined random order. For example, as shown in Figure 2 (c, d, e, f), the participants were required to "adjust the radio frequency to FM 92.5" in the expandable + consistent condition. The participants could complete the task by selecting the radio (Figure 2 (c)), FM/AM (Figure 2 (d)), FM (Figure 2 (e)), and 92.5Mhz (Figure 2 (f)), in order.
2.3 Participants
We recruited 38 participants (19 males and 19 females ranging 23 to 59 in age) from an online advertisement website. There were 21 participants in the younger group (mean age = 27.8 years, SD = 3.77) and 19 participants in the older group (mean age = 51.0 years, SD = 5.28).
2.4 Apparatus and settings
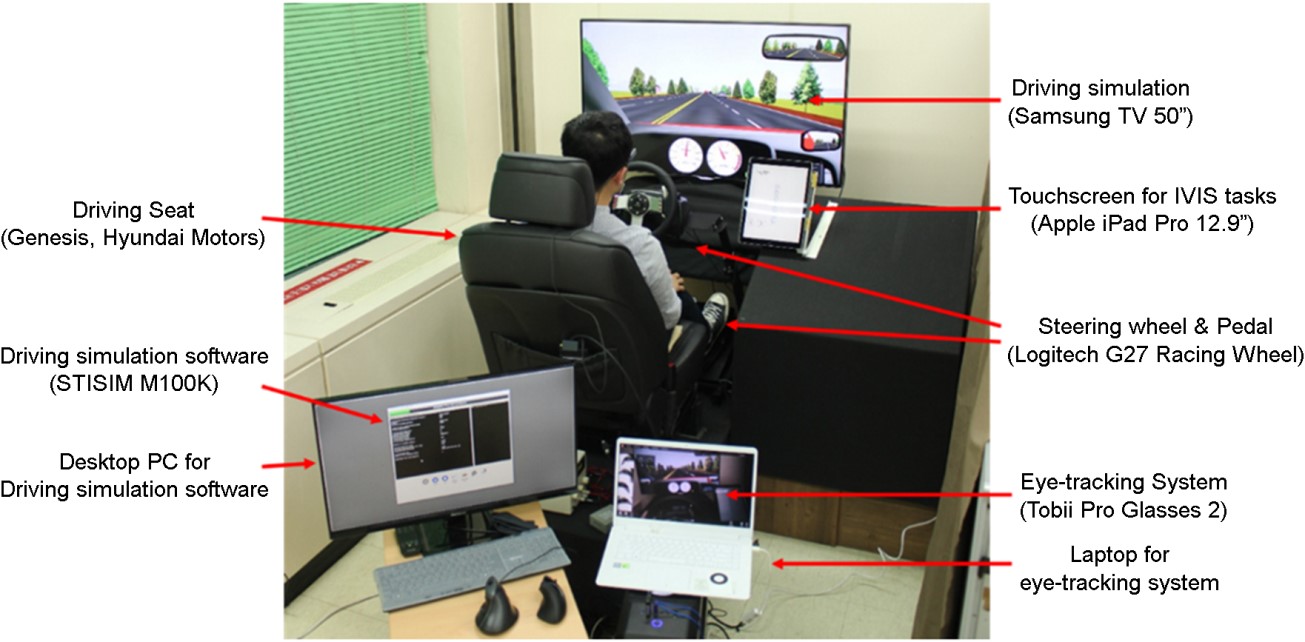
The experiment was conducted using a driving simulator consisting of a mock vehicle with a steering wheel, an accelerator, a brake pedal, a seat, a monitor, and a tablet PC. Figure 3 shows the apparatus and experimental settings. We constructed a mock vehicle driving simulator and used STISIM M100K driving simulation software. For the steering wheel and pedal, we used a G27 Racing Wheel from Logitech. The driving seat used was of the Genesis made by Hyundai Motors. The participants were able to adjust the seat position, height, and angle to achieve a comfortable posture. The car driving environment was presented on a 50-inch monitor, manufactured by Samsung Electronics. An Apple iPad Pro 12.9-inch model was used to present the IVIS tasks. The hardware and software for measuring glance behaviors were made by Tobii Technology (Tobii Pro Glasses 2 and Tobii Pro Lab). The experimental software application was developed based on the iOS operating system to provide secondary IVIS tasks and record the time of all touch behaviors conducted on the screen.
2.5 Procedure
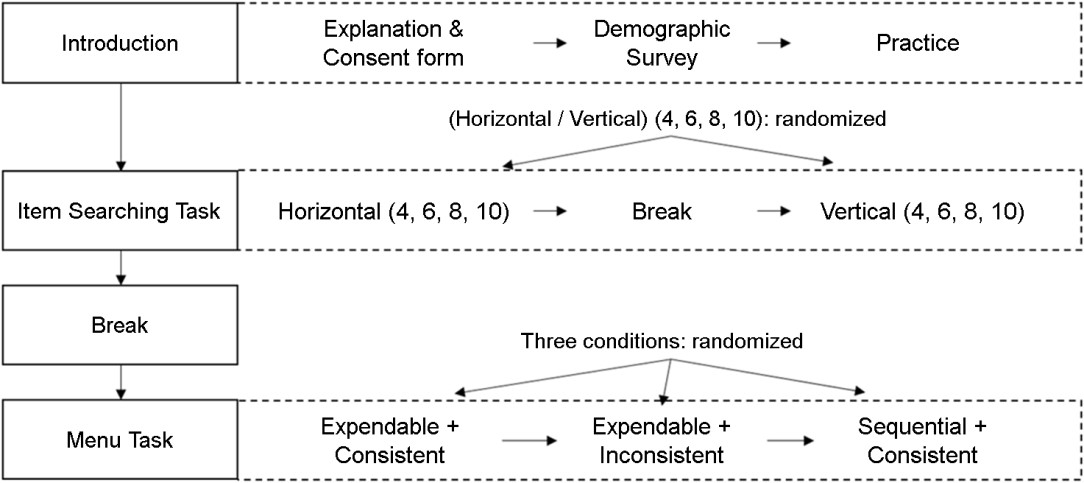
Figure 4 shows the overall procedure applied. First, the researcher explained the basic information regarding the experiment and received a consent form. The participants had sufficient time to become accustomed to the driving simulator, two IVIS tasks, and the menu structure. After the practice session, the participants wore an eye-tracking device and the calibration process was performed.
During the main session, the participants were required to conduct the driving and IVIS tasks simultaneously. Because the individual experiments included separate independent variables, the order of the experiments was identical regardless of the subject. However, within each experiment, the order of the procedure was randomized to avoid learning effects. A short break was provided to prevent fatigue. When the participants returned from the break, the calibration process was repeated to improve the validity of the eye-tracking measurements. After the participants completed the tasks under the horizontal and the vertical conditions for the item search task, and the three conditions of the menu task, their subjective workload score was evaluated based on the driving activity load index (DALI) questionnaire items. All experimental procedures were approved by the institutional review board of the university.
2.6 Data collection and analysis
Data on the driving performance, glance behavior, and item searching task performance were automatically collected from the STISIM driving simulation software, Tobii Pro Glasses 2, and the experimental application, respectively. The subjective workload data were collected using paper-based questionnaire items. These raw data were used to calculate the dependent measures. The values and scores of each measurement were first calculated based on the individual participant, and this value was used to analyze the statistical differences based on the task conditions.
All statistical analyses were performed using IBM SPSS Statistics version 24.0. The Shapiro-Wilk normality test and Mauchly's test of sphericity were first used to check the basic assumptions for conducting an analysis of variance (ANOVA). When the data were not normally distributed under a particular condition, a non-parametric equivalent of ANOVA was executed using the rank data after an aligned rank transform (ART) procedure was applied (Wobbrock et al., 2011). The ART procedure allows analyzing the interaction effects of variables even when the data are of non-parametric form. If only the assumption of sphericity were violated, then the degree of freedom was corrected using the Greenhouse-Geisser method. When significant effects were found for the variables, pairwise comparisons were conducted using the Bonferroni correction procedure.
3.1 Effects of and presentation format and the number of items per screen
3.1.1 Driving performance
A three-way ANOVA was conducted to determine the effects of the presentation format, number of items, and age group on the standard deviation of the lateral position (SDLP) and standard deviation of the headway distance (SDHD). The results of the ANOVA with SDLP showed that only the age effect was significant among the main effects (F (1, 283) = 132.05, p < 0.05), whereas the other main and interaction effects were shown to be insignificant. The pairwise comparison indicated that the older group exhibited difficulty in maintaining the lane compared to the younger group (p < 0.05). The results of the ANOVA with SDHD were similar to those with the SDLP. The main effect of the age variable was significant (F (1, 283) = 89.69, p < 0.05), whereas the other main and interaction effects were not. A post hoc analysis for the pairwise comparison exhibited a significant increase in the distance between age groups (p < 0.05).
3.1.2 Glance behavior
Total eye-off road time (TEORT)
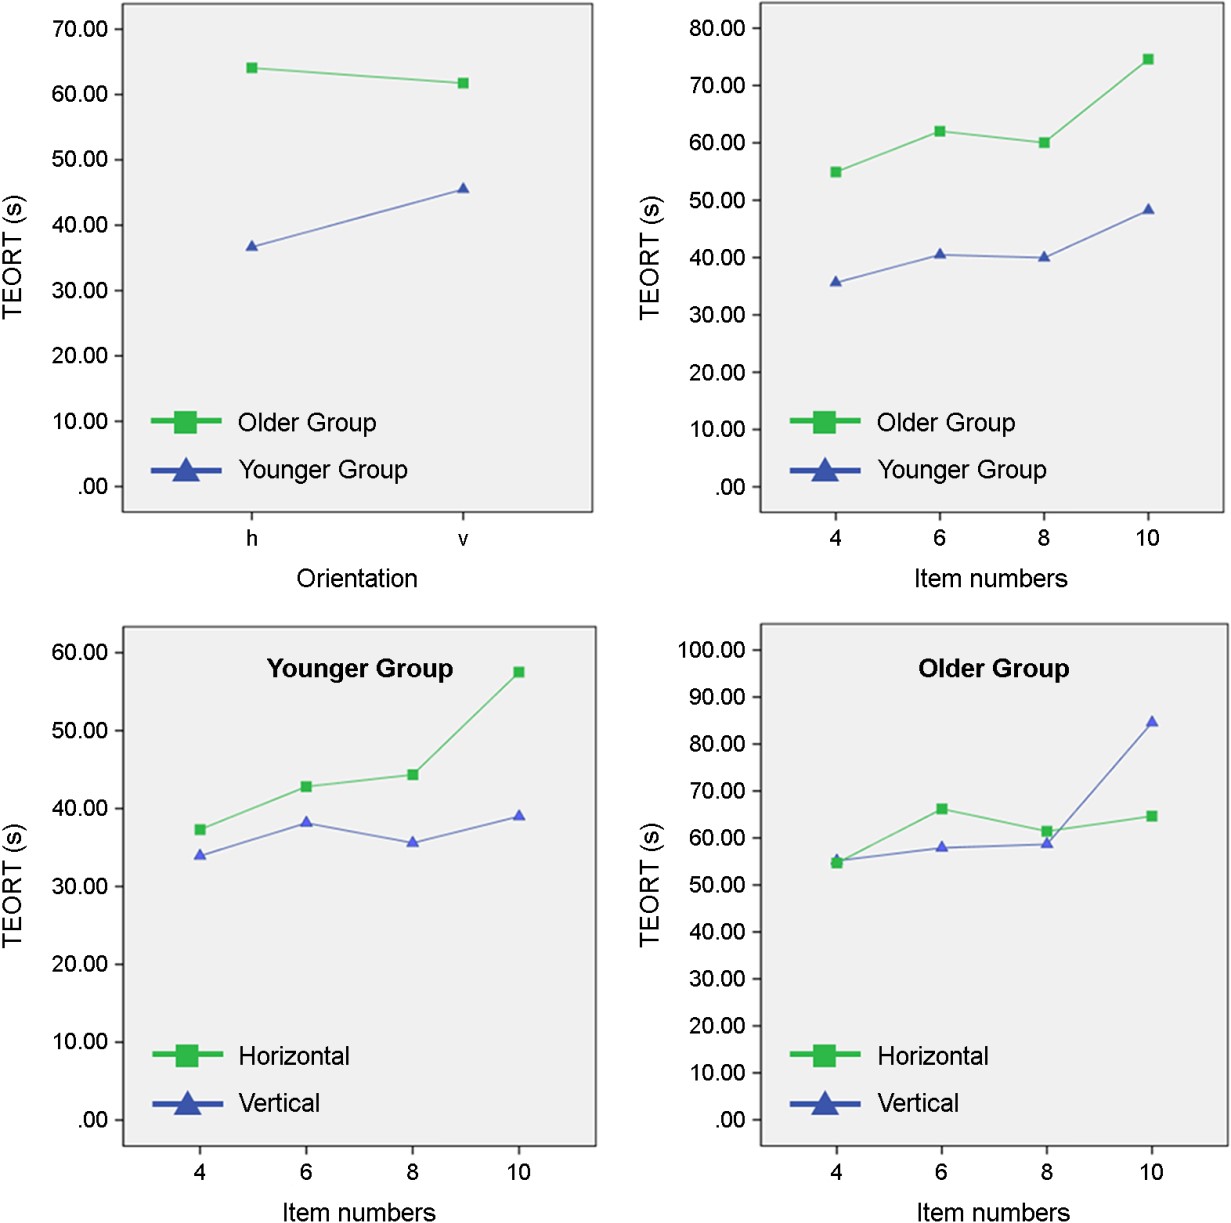
Because the assumption of sphericity was violated, the repeated measure ANOVA using the Greenhouse-Geisser corrected values was applied. A summary of the ANOVA results is shown in Table 2. The main effects of age and the presentation format were significant, whereas the number of items did not produce a significant effect. Pairwise comparisons showed that the TEORT of the older group was higher than that of the younger group (p < 0.05; younger (41.08s), older (62.90s)), and the TEORT of ten items per screen was higher than that of other conditions (4 (45.27s), 6 (51.26s), 8 (50.00s), 10 (61.42s)). Only the interaction effects of the presentation format and age were significant, and pairwise comparisons showed that the TEORT of the younger group under the horizontal condition was lower than that of the other conditions (Figure 5, upper left). The three-way interaction was significant, which was evident from the different results with ten item numbers (Figure 5, lower).
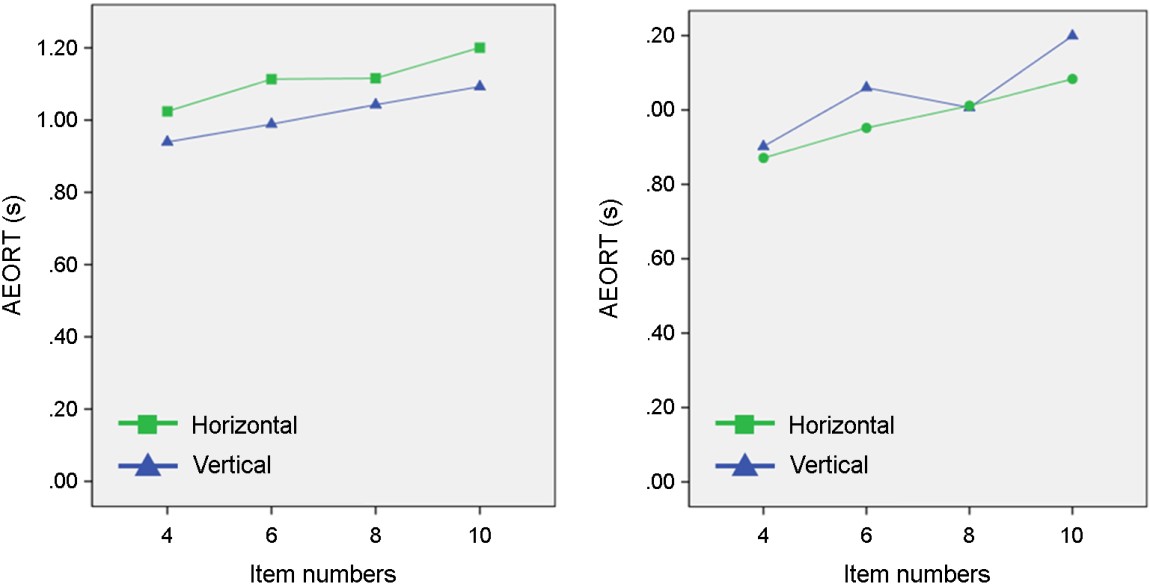
Average eye-off-road time (AEORT)
The repeated measure ANOVA was conducted using the Greenhouse-Geisser correction values under the violated condition because the sphericity was not satisfied. The ANOVA results showed that the number of items per screen was the only variable affecting the AEORT (p < 0.05; 4 (0.93s), 6 (1.03s), 8 (1.04s), 10 (1.14s)). Table 2 shows the ANOVA results.
|
DV |
Variables |
df |
F |
p |
|
|
TEORT |
Presentation format |
1 |
1.522 |
0.226 |
0.042 |
|
Item numbers |
3 |
9.523 |
0.000 |
0.214 |
|
|
Age |
1 |
7.469 |
0.010 |
0.176 |
|
|
Presentation format × item numbers |
3 |
0.629 |
0.550 |
0.018 |
|
|
Presentation format × age |
1 |
4.506 |
0.041 |
0.114 |
|
|
Item numbers × age |
3 |
0.513 |
0.633 |
0.014 |
|
|
Presentation format × item numbers × age |
3 |
4.606 |
0.011 |
0.116 |
|
|
AEORT |
Presentation format |
1 |
0.223 |
0.640 |
0.007 |
|
Item numbers |
3 |
13.346 |
0.000 |
0.282 |
|
|
Age |
1 |
0.879 |
0.355 |
0.025 |
|
|
Presentation format × item numbers |
3 |
0.031 |
0.982 |
0.001 |
|
|
Presentation format × age |
1 |
2.678 |
0.111 |
0.073 |
|
|
Item numbers × age |
3 |
0.694 |
0.558 |
0.020 |
|
|
Presentation format × item numbers × age |
3 |
0.019 |
0.385 |
0.716 |
3.1.3 Usability measures and workload
Task Completion Time (TCT)
The aligned rank transform (ART) data of the TCT were used to conduct the ANOVA. The results showed that age was the only variable affecting the TCT (F (1, 268) = 230.116, p < 0.05). Pairwise comparisons indicate that the TCT of the older group was significantly higher than that of the younger group (p < 0.05; older, 24.37s; younger, 11.05s).
Number of misses
We considered cases in which the participants did not catch the target word even when presented on the current page as a miss. Based on this, we calculated the number of success trials without a miss and the number of success trials after a miss. Chi-square tests were conducted to compare the proportions of the number of successful trials without missing the target word. No differences were shown between the horizontal and vertical conditions (χ^2(1) = 0.208, p = 0.648; horizontal (94.3%), vertical (94.7%)), although the ratio differed according to the number of items per screen (χ^2(3) = 21.212, p < 0.05; 4 (96.7%), 6 (94.6%), 8 (95.3%), 10 (91.3%)) and age (χ^2(1) = 3.906, p < 0.05; younger (95.3%), older (93.5%)). Table 3 shows the number of misses trials.
Workload
The effects of the main and interaction effects were not significant. Only the stress scores of the younger group showed a significant difference between the horizontal and vertical formats (t (20) = 3.009, p < 0.01).
|
Age |
dv |
Condition |
Total |
|||||||
|
h4 |
h6 |
h8 |
h10 |
v4 |
v6 |
v8 |
v10 |
|||
|
Younger |
Success without miss |
183 |
182 |
174 |
176 |
184 |
181 |
181 |
170 |
1,431 |
|
Success after miss |
6 |
7 |
5 |
13 |
5 |
8 |
8 |
19 |
71 |
|
|
Older |
Success without miss |
146 |
142 |
134 |
137 |
147 |
130 |
142 |
134 |
1,112 |
|
Success after miss |
8 |
11 |
10 |
17 |
3 |
10 |
8 |
10 |
77 |
|
3.2 Effects of menu task conditions
3.2.1 Driving performance
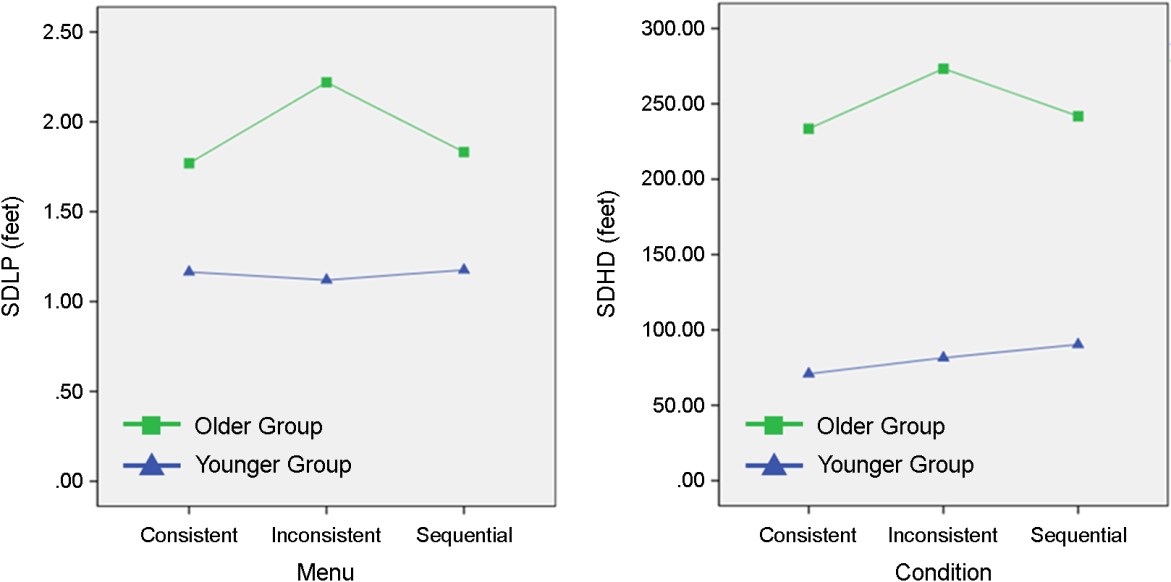
A two-way ANOVA was conducted to investigate the effects of the age and menu conditions. The results of the ANOVA revealed that the main and interaction effects were both significant (menu condition: F (2, 62) = 3.485, p < 0.05; age: F (1, 31) = 19.889, p < 0.01; menu condition × age: F (2, 62) = 5.527, p < 0.01). The differences between the conditions are shown in Figure 6 (left). Pairwise comparisons showed that there were no differences depending on the menu condition for the younger group, whereas the older group found it more difficult to maintain the lane under inconsistent conditions as compared to the other conditions (consistent-inconsistent: p < 0.05, consistent-sequential: p = 0.05, inconsistent-sequential: p < 0.05).
SDHD
A two-way ANOVA was conducted to analyze the effects of age and the menu condition. Although the SDHD patterns were similar to those of the SDLP (Figure 6, right), the differences were not statistically significant across all conditions. The SDHD differed depending on the age groups (F (1, 105) = 75.63, p < 0.01), but no differences were observed according to the menu condition or the interaction effects.
3.2.2 Glance behavior
TEORT
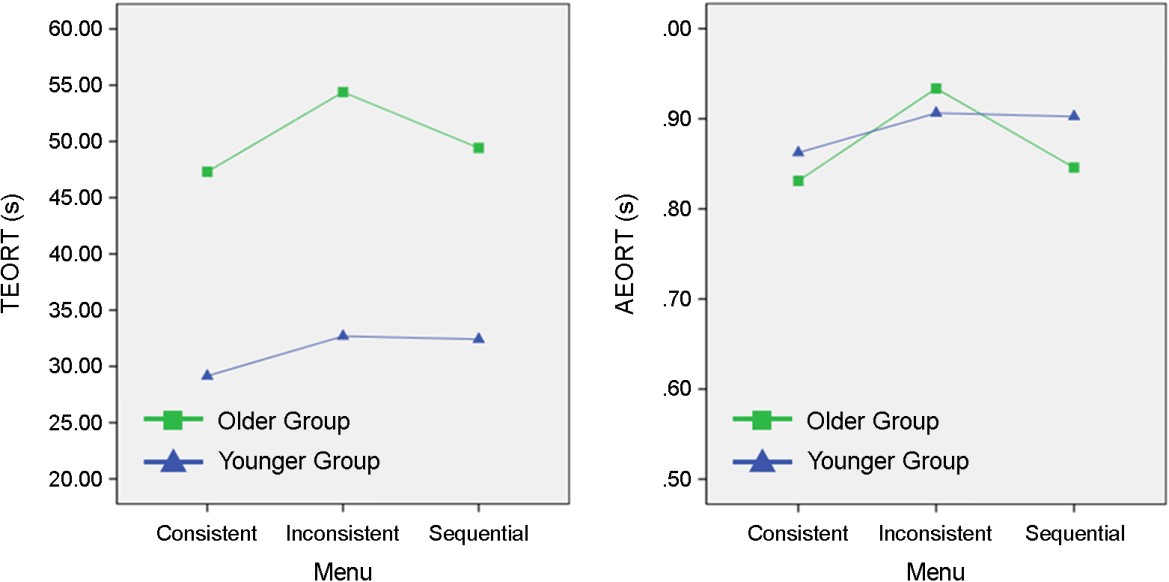
The TEORT of the older and younger groups under each condition is shown in Figure 7 (left). Older drivers spent more time on the IVIS display than the younger drivers (F (1, 34) = 9.178, p < 0.01), and the TEORT also differed according to the menu condition (F (2, 68) = 3.412, p < 0.05). However, there was no interaction effect between the age and menu variables.
AEORT
The AEORT of the inconsistent menu was slightly higher than that of the other menu type; however, only a suggestive significance was observed (menu condition: F (2, 64) = 2.495, p = 0.09). Age and the interaction effects were not significant. These differences are shown in Figure 7 (right).
3.2.3 Task completion time and workload
TCT
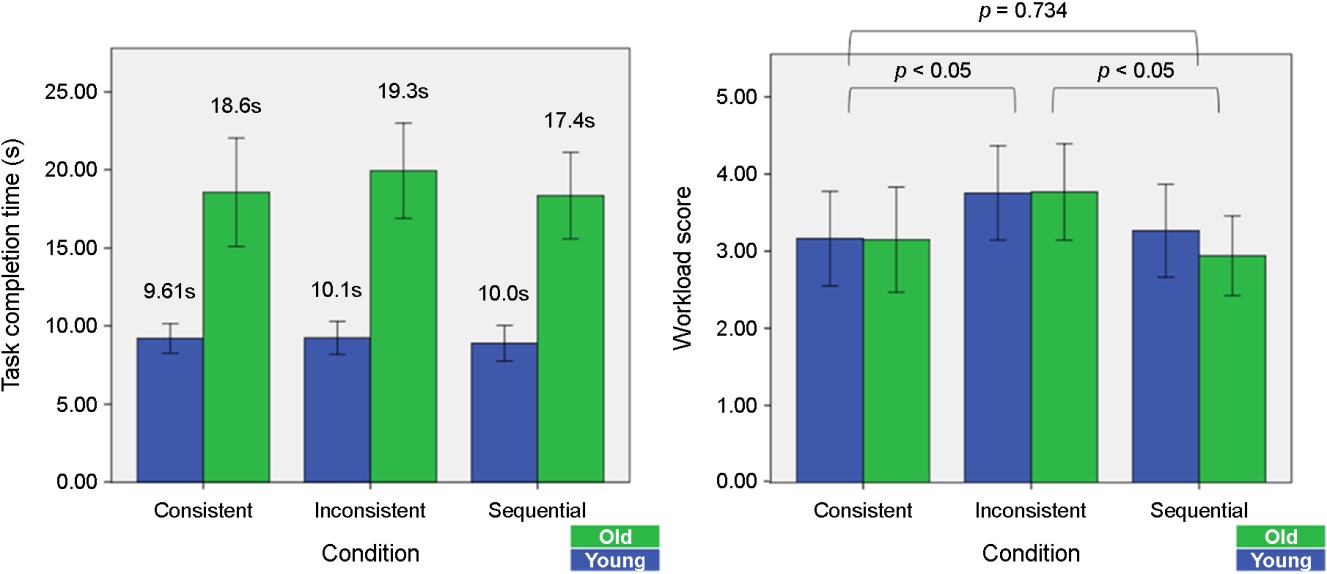
The older group took approximately 13s to complete the task (consistent: 13.40s, inconsistent: 14.39s, sequential: 13.91s), and the younger group took approximately 7s (consistent: 7.29s, inconsistent: 7.65s, sequential: 7.56s), which was a statistically significant difference based on the ANOVA results (F (1, 94) = 98.438, p < 0.01); however, none of the other effects exhibited any statistically significant differences. Figure 8 (left) shows that there is a difference in TCT based on age.
Workload
The ANOVA results showed that the menu condition had a significant effect on the workload score (F (2, 70) = 10.536, p < 0.01), whereas the effects of age and interaction were not significant. Figure 8 (right) shows the level of workload for each condition.
4.1 Item searching task variables
The number of item numbers per screen
The number of items per screen exhibited a significant effect on the driving behavior. Although the driving performance did not significantly differ depending on the number of items, TEORT, AEORT, and the ratio of misses were significantly increased as the item numbers increased regardless of the driver's age. Our results showed that when fewer than eight items were on the screen, the effects of the item searching tasks on the driving safety were similar. Notably, however, when the number of items per screen increased to 10, the adverse effects increased significantly. Although the TCT was similar regardless of the conditions, the TEORT was much higher in the condition with 10 item numbers. In addition, the AEORT gradually increased as the number of items increased. In particular, when 10 items were shown, AEORT was found to be significantly longer than that for the other conditions. Furthermore, drivers tended to miss the target word more frequently in the condition with 10 item numbers. The findings from different measurements showed that when the number of items per screen reached 10, it became more difficult for drivers to perform an item searching while driving.
The findings of this study can be compared to those of previous studies. Kujala and Salvucci (2015) examined the effects of the number of items on the visual search behaviors using a cognitive modeling technique. They showed that the visual distraction increases as the number of items increases from 6 to 9 to 12. Large et al. (Large et al., 2017) showed that task difficulty increases as the number of items increases. In particular, it was observed that time required increases more rapidly for 36 items than for 1, 4, and 9 items because the time required for item search/decision action is based on a logarithmic function. These results are in line with the findings of the present study, which supports the idea that an item searching task is much more difficult to conduct when the number of items per screen reaches 10. Feng et al. (2017) also observed that the task efficiency is negatively affected by an increase in the number of items, which varied among 4, 8, and 15 in their study. In their analysis, TEORT significantly increases as the number of items increases, and the AEORT for 15 items was larger than that of 4 item numbers. Based on these results, they concluded that 4 item numbers should be recommended. Essentially, the conclusion of the study by Feng et al. (2017) is more conservative than that of the present study. These differences are understandable considering the fact that the glancing behavior of drivers measured based on a grid-based form is worse than that based on a list-based form (Kujala and Salvucci, 2015).
Presentation format
It is difficult to identify the effects of the presentation format. Although prior studies, in the context of PC tasks, indicated that the presentation format has a significant influence on the behavior of a human operator (Benbasat and Dexter, 1986; Jacko and Salvendy, 1996; Vessey, 1991), we did not observe any differences in the horizontal or vertical formats.
Differences in the horizontal and vertical conditions were significant only for visual distraction measures among the younger age group. As shown in Figure 5 (upper left), the TEORT of the younger group was higher in the vertical condition than the horizontal condition. In addition, the AEORT for the younger group was higher under the vertical condition regardless of the number of items (Figure 9). This difference slightly influences the subjective workload. In terms of the workload criteria, the stress score for the vertical format was higher than that for the horizontal format (t (20) = 3.01, p < 0.01); however, in the older group, no significant differences were identified. Therefore, although the presentation format produced differences according to the age group, these differences were not sufficient to create significant differences in the overall measures.
4.2 Menu task variables
We compared three different menus (expandable + consistent, expandable + inconsistent, sequential + consistent). The results showed that the expandable and inconsistent menu had the worst outcome. Compared to an expandable and consistent menu, the menu orientation consistency significantly influences the driving performance, visual distraction, and subjective evaluation. Although the younger group did not exhibit any considerable differences in behavior between the consistent and inconsistent menus, these differences were significant in the older group. The driving performances of the older group were lower under the inconsistent condition, and visual distraction was higher. In addition, the subjective workload score was higher in the inconsistent conditions regardless of the driver's age. Therefore, if the orientation in the menu structure is inconsistent, it may be concluded that it is much more difficult to perform both driving and IVIS tasks concurrently. Given that the proportion of older drivers is gradually increasing, it is important to consider the orientation consistency when designing the menu interfaces. Therefore, along with the findings of prior studies, it is possible to suggest that the consistency within the hierarchical menu structure should be maintained.
However, the expandable and consistent menu showed similar results with the sequential and consistent menu. Although each menu style has its own pros and cons in terms of the menu navigation and visual complexity, it seems that the task applied in this study did not gain any benefit from the various menu styles considered. Therefore, based on the findings of this study, we must remain conservative, in line with the findings by Li et al. (2017), on the potential differences between expandable and sequential menus. Their study concluded that the expandable menu is more advantageous than the sequential menu under most driving situations. However, the expandable menu applied was designed using a list format, whereas the sequential menu was based on a grid format. Therefore, this advantage seems to be due to the influence of the other design variables (e.g., grid or list) and not because of the differences between the expandable and sequential menus.
4.3 Age-related differences
First, for all tasks, the time taken to conduct the tasks and the TEORT for performing IVIS tasks were longer among the older age groups than the younger age groups. This is thought to be due to the overall physical/cognitive decline of older drivers. Because the time required to perform non-driving tasks while driving is relatively long, focus on driving tasks is lowered and the driving performance declines. In fact, when both the TCT and TEORT times were significantly higher, the driving performance was observed to worsen.
In contrast, AEORT showed a somewhat different tendency compared to the other measures. In general, higher AEORT values indicate that more visual attention is required to conduct IVIS tasks. Therefore, it is more likely that the AEORT value will be higher as the task execution becomes more difficult, and it was expected that the AEORT for older drivers would be higher than that for young drivers. However, the AEORT level for young drivers was shown to be generally higher than that of older drivers. During the experiments described in this paper, the average AEORT range was approximately 0.8~1.2s, which indicates that the AEORT required to conduct the IVIS task in this study did not reach a critical level of risk (considered to be 1.6s). Although the AEORT of young drivers is larger, it cannot be concluded that the younger drivers experienced more difficulty. Rather, it may be reasonable to infer that the younger group could afford to spend more time assigning tasks within a non-hazardous range.
It is worth noting that differences owing to the specific design variables occurred only for certain age groups. With the item searching task, the younger driver group required more TEORT under the vertical condition than under the horizontal condition. However, there were no differences observed among the elderly driver group. In other words, only the young driver group exhibited the predicted difference. However, for the menu task, most of the influence from the design variables resulted from difficulties experienced by the older driver group. The younger driver group showed similar performances regardless of the menu type. However, in the elderly driver group, inconsistent conditions were found to cause more difficulties in drivers than consistent and sequential conditions for most of the indicators applied. The differences within the younger and older driver groups can be interpreted differently. In the case of differences among the design factors found only in the younger driver group, it can be observed that older drivers found it difficult to perform the task regardless of the conditions applied. By contrast, when a difference was identified only in the older group, the younger driver group can be considered to have performed the task easily regardless of the influence of the design factors. Therefore, it is necessary to design a touch-based IVIS based on an understanding of the potential differences according to the age group of the drivers.
In addition, it is interesting to note that most of the quantitative measures differed according to the driver group, whereas the perceived difficulty reported by the drivers showed no significant difference regardless of the task. This result highlights the necessity of considering both objective and quantitative measures when evaluating an IVIS design.
4.4 Conclusions and recommendations
Based on the findings of this study, the following conclusions and recommendations are proposed for the design of an in-vehicle touch interface.
When designing menus or lists for applying a touch task while driving, it is recommended that the number of items per screen be eight or less to reduce its impact on the driver behavior.
When designing a menu, the orientation of each menu level should be unified so that there is no negative influence of disorientation.
When the menu structure has a simple structure, differences in the menu structure (whether expandable or sequential) do not have a significant effect on the driver. However, if the complexity of the information structure required by the task increases, it is necessary to be cautious about making an approach based on this conclusion.
4.5 Limitations
Several limitations should be considered in future studies. First, in this study, an experimental application was developed to examine the effects of the design variables on the driving behavior. Because various design factors can affect the actual user interface, there is a need for further research using a complete IVIS user interface. Second, in this study, IVIS tasks imitating those of an actual an IVIS were designed; however, we did not implement a complete system in which the actual function is applied. Third, although our findings showed differences depending on the drivers' age, few participants of the older driver group were aged 65 years or more. One reason for the poor enrollment is that people in Korea tend to stop driving relatively earlier than in other countries because of the complex road environment and a highly developed public transportation system, making it extremely difficult to recruit Korean drivers over 65 years in age. For this reason, only younger and moderately older drivers in this study were distinguished. Therefore, further research is necessary to consider the characteristics of elderly drivers.
References
1. Benbasat, I. and Dexter, A.S., An Investigation of the Effectiveness of Color and Graphical Information Presentation Under Varying Time Constraints. MIS Quarterly, 59-83, 1986. https://doi.org/10.2307/248881
2. Colley, A., Väyrynen, J. and Häkkilä, J., In-Car Touch Screen Interaction: Comparing standard, finger-specific and multi-finger interaction. Proceedings of the 4th International Symposium on Pervasive Displays - PerDis '15, 131-137, 2015. https://doi.org/ 10.1145/2757710.2757724
Google Scholar
3. Crandall, J.M. and Chaparro, A., Driver distraction: Effects of text entry methods on driving performance. Proceedings of the Human Factors and Ergonomics Society, 1693-1697, 2012. https://doi.org/10.1177/1071181312561339
Google Scholar
4. Dukic, T., Hanson, L. and Falkmer, T., Effect of drivers' age and push button locations on visual time off road, steering wheel deviation and safety perception. Ergonomics, 49(1), 78-92, 2006. https://doi.org/10.1080/00207540500422320
Google Scholar
5. Dukic, T., Hanson, L., Holmqvist, K. and Wartenberg, C., Effect of button location on driver's visual behaviour and safety perception. Ergonomics, 48(4), 399-410, 2005. https://doi.org/10.1080/00140130400029092
Google Scholar
6. Feng, F., Liu, Y. and Chen, Y., Effects of Quantity and Size of Buttons of In-Vehicle Touch Screen on Drivers' Eye Glance Behavior. International Journal of Human-Computer Interaction, 00(00), 1-14, 2017. https://doi.org/10.1080/10447318.2017.1415688
Google Scholar
7. Fleischmann, T., Model based HMI specification in an automotive context. Lecture Notes in Computer Science (Including Subseries Lecture Notes in Artificial Intelligence and Lecture Notes in Bioinformatics), 4557 LNCS (PART 1), 31-39, 2007. http://www.scopus.com /inward/record.url?eid=2-s2.0-38149052898&partnerID=tZOtx3y1
Google Scholar
8. Fleming, B., Battery switching, driving dynamics, and touch-screen control input. IEEE Vehicular Technology Magazine, 5(4), 4-7, 2010. https://doi.org/10.1109/MVT.2010.939101
Google Scholar
9. Harvey, C. and Stanton, N.A., Usability Evaluation for In-Vehicle Systems. In CRC Press Taylor & Francis Group (Vol. 53, Issue 9), 2013. https://doi.org/10.1017/CBO9781107415324.004
10. Hong, S.P., Jung, E.S., Choe, J. and Kim, J.H., Design of a Menu Structure for the Instrument Cluster IVIS using Taguchi Method. Proceedings of the International MultiConference of Engineers and Computer Scientists, III, 2010.
Google Scholar
11. Horberry, T., Anderson, J., Regan, M.A., Triggs, T.J. and Brown, J., Driver distraction: The effects of concurrent in-vehicle tasks, road environment complexity and age on driving performance. Accident Analysis and Prevention, 38(1), 185-191, 2006. https://doi.org/ 10.1016/j.aap.2005.09.007
Google Scholar
12. Jacko, J. and Salvendy, G., Hierarchical menu design: breadth, depth and task complexity. Sperceptual and Motor Skills, 82, 1187-1201, 1996. https://doi.org/10.2466/pms.1996.82.3c.1187
Google Scholar
13. Kim, H., Kwon, S., Heo, J., Lee, H. and Chung, M.K., The effect of touch-key size on the usability of In-Vehicle Information Systems and driving safety during simulated driving. Applied Ergonomics, 45(3), 379-388, 2014a. https://doi.org/10.1016/j.apergo.2013.05.006
14. Kim, H. and Song, H., Evaluation of the safety and usability of touch gestures in operating in-vehicle information systems with visual occlusion. Applied Ergonomics, 45(3), 789-798, 2014b. https://doi.org/10.1016/j.apergo.2013.10.013
15. Kujala, T. and Saariluoma, P., Effects of menu structure and touch screen scrolling style on the variability of glance durations during in-vehicle visual search tasks. Ergonomics, 54(8), 716-732, 2011. https://doi.org/10.1080/00140139.2011.592601
Google Scholar
16. Kujala, T. and Salvucci, D.D., Modeling visual sampling on in-car displays: The challenge of predicting safety-critical lapses of control. International Journal of Human Computer Studies, 79, 66-78, 2015. https://doi.org/10.1016/j.ijhcs.2015.02.009
Google Scholar
17. Kurniawan, S.H., Ellis, R.D. and Zaphiris, P., Comparing Older and Younger Adults' Traversal Time in Expandable and Non-Expandable Hierarchical Structures. Proceedings of Human Factors and Ergonomics Society 46th Annual Meeting, 185-188, 2002. https:// doi.org/10.1177/154193120204600203
Google Scholar
18. Large, D.R., Burnett, G., Crundall, E., Loon, E.V., Eren, A.L. and Skrypchuk, L., Developing Predictive Equations to Model the Visual Demand of In-Vehicle Touchscreen HMIs. International Journal of Human-Computer Interaction, 00(00), 1-40, 2017. https:// doi.org/10.1080/10447318.2017.1306940
Google Scholar
19. Large, D.R., Burnett, G.E., Crundall, E., Lawson, G. and De-kremer, A., Measuring the distraction of alternative list-scrolling techniques when using interactive touchscreen displays in vehicles. 3rd International Conference on Driver Distraction and Inattention, August, 2013.
Google Scholar
20. Lasch, A. and Kujala, T., Designing browsing for in-car music player: effects of touch screen scrolling techniques, items per page and screen orientation on driver distraction. Proceedings of the 4th International Conference on Automotive User Interfaces and Interactive Vehicular Applications, 41-48, 2012. https:// doi.org/10.1145/2390256.2390262
Google Scholar
21. Lee, S.C., Kim, Y.W. and Ji, Y.G., Effects of visual complexity of in-vehicle information display: Age-related differences in visual search task in the driving context. Applied Ergonomics, 81, 102888, 2019a. https://doi.org/10.1016/j.apergo.2019.102888
Google Scholar
22. Lee, S.C., Yoon, S.H. and Ji, Y.G., Modeling task completion time of in-vehicle information systems while driving with keystroke level modeling. International Journal of Industrial Ergonomics, 72, 252-260, 2019b. https://doi.org/10.1016/j.ergon.2019.06.001
Google Scholar
23. Li, R., Chen, Y.V., Sha, C. and Lu, Z., Effects of interface layout on the usability of In-Vehicle Information Systems and driving safety. Displays, 49, 124-132, 2017. https://doi.org/10.1016/j.displa.2017.07.008
Google Scholar
24. National Highway Traffic Safety Administration., Visual-manual NHTSA driver distraction guidelines for in-vehicle electronic devices. In Washington, DC: National Highway Traffic Safety Administration (NHTSA), Department of Transportation (DOT), 2012. https://doi.org/NHTSA-2010-0053
25. Oh, H.J., Ko, S.M. and Ji, Y.G., Effects of Superimposition of a Head-Up Display on Driving Performance and Glance Behavior in the Elderly. International Journal of Human-Computer Interaction, 32(2), 143-154, 2016. https://doi.org/10.1080/10447318.2015.1104155
Google Scholar
26. Pauzie, A., A method to assess the driver mental workload: the driving activity load index (DALI). IET Intelligent Transport Systems, 2, 315-322, 2008. https://doi.org/10.1049/iet-its
27. Peng, Y., Boyle, L.N. and Lee, J.D., Reading, typing, and driving: How interactions with in-vehicle systems degrade driving performance. Transportation Research Part F: Traffic Psychology and Behaviour, 27, 182-191, 2014. https://doi.org/10.1016/j.trf.2014.06.001
28. Reimer, B., Mehler, B., Donmez, B., Pala, S., Wang, Y., Zaho, N., Olson, K., Wenzel, J. and Coughlin, J.F., A driving simulator study examining phone dialing with an iPhone vs. a button style flip-phone. Proceedings of the Human Factors and Ergonomics Society, 2191-2195, 2012. https://doi.org/10.1177/1071181312561462
Google Scholar
29. Scott, B. and Conzola, V., Designing touch screen numeric keypads: Effects of finger size, key size, and key spacing. Proceedings of the Human Factors and Ergonomics Society Annual Meeting, 41(6), 360-364, 1997. https://doi.org/10.1177/107118139704100180
Google Scholar
30. Sears, A., Plaisant, C. and Schneiderman, B., A New Era for High-Precision Touchscreens. In Advances in Human-Computer Interaction (Vol. 3, pp. 1-33), 1992.
Google Scholar
31. Swette, R., May, K.R., Gable, T.M. and Walker, B.N., Comparing three novel multimodal touch interfaces for infotainment menus. Proceedings of the 5th International Conference on Automotive User Interfaces and Interactive Vehicular Applications - AutomotiveUI '13, 100-107, 2013. https://doi.org/10.1145/2516540.2516559
Google Scholar
32. Tao, D., Yuan, J., Liu, S. and Qu, X., Effects of button design characteristics on performance and perceptions of touchscreen use. International Journal of Industrial Ergonomics, 64, 59-68, 2018. https://doi.org/10.1016/j.ergon.2017.12.001
Google Scholar
33. Vessey, I., Cognitive Fit: A Theory-Based Analysis of the Graphs Versus Tables Literature. Decision Sciences, 22(2), 219-240, 1991. https://doi.org/10.1111/j.1540-5915.1991.tb00344.x
Google Scholar
34. Wobbrock, J.O., Findlater, L., Gergle, D. and Higgins, J.J., The aligned rank transform for nonparametric factorial analyses using only anova procedures. Proceedings of the 2011 Annual Conference on Human Factors in Computing Systems - CHI '11, 143, 2011. https://doi.org/10.1145/1978942.1978963
Google Scholar
35. Zaphiris, P., Shneiderman, B. and Norman, K.L., Expandable indexes vs. sequential menus for searching hierarchies on the world wide web. Behaviour and Information Technology, 21(3), 201-207, 2002. https://doi.org/10.1080/0144929021000009045
Google Scholar
PIDS App ServiceClick here!