eISSN: 2093-8462 http://jesk.or.kr
Open Access, Peer-reviewed
eISSN: 2093-8462 http://jesk.or.kr
Open Access, Peer-reviewed
Amir Tjolleng
, Kihyo Jung
10.5143/JESK.2020.39.6.625 Epub 2021 January 04
Abstract
Objective: This study developed a real-time system to detect driver's cognitive load using a multi-layer artificial neural network (MANN) based on electrocardiography (ECG) signals. The real-time system was aimed at classifying driver's status into either normal or overload.
Background: Driving with cognitive load is considered as one of significant factors for traffic accidents. Thus, an early detection of this risky status while driving is needed to prevent vehicle accidents.
Method: The ECG signals of this study were measured from 22 participants who performed simulator-based driving experiment under two different conditions (1: normal driving, 2: overload driving (driving while doing a two-back task or an arithmetic task)). A real-time detection system was developed using MANN on the ECG signals and its effectiveness was evaluated for two new participants who drove under the two driving conditions.
Results: The MANN model used for the real-time detection system showed perfect accuracy (100%), sensitivity (100%), and specificity (100%) for both of the training and testing data sets. In addition, the proposed real-time detection system successfully detected the change of participant's status with a reasonable time delay (mean = 4.5 seconds).
Conclusion: This study demonstrated that the ECG signals can be used as a biometric measure for the detection of the driver's cognitive status in real-time.
Application: The proposed detection system would be useful for the development of an intelligent vehicle that can provide timely interventions and/or warnings at the early onset of cognitive overload.
Keywords
Driver cognitive load Multi-layer artificial neural network Heart rate variability Vehicle accident prevention
Driving under cognitive load is considered as one of contributing factors for vehicle accidents. This risky driving can decrease the amount of residual attention in which may lead to vehicle crashes (Li et al., 2018; Kountouriotis et al., 2016). The U.S. National Highway Traffic Safety Administration (2017) reported that there were 3,477 fatalities and 391,000 injuries in vehicle crashes resulting from distracted driving due to cognitive load (e.g., thinking of something or finding a direction while driving; Zeeb et al., 2016; Reimer et al., 2013). Thus, an accurate real-time detection system of cognitive load while driving is necessary to prevent accidents and improve the traffic safety on the road.
Electrocardiography (ECG) can be considered as a reliable measure to identify whether a driver is under cognitive load or not. ECG signals represent electrical activities of the heart in which can be quantified in terms of time and frequency domains (Tarvainen et al., 2014). The time domain includes mean inter-beat interval (IBI), standard deviation of IBIs (SDNN), and root mean squared difference of adjacent IBIs (RMSSD). The frequency domain includes power at a low frequency (LF), power at a high frequency (HF), and LF/HF ratio. These heart rate variabilities (HRV) derived from ECG signals reflect the human ongoing internal physiological state that cannot be intentionally hidden (called tell-tale sign; Piotrowski and Szypulska, 2017; Sahayadhas et al., 2013). In addition, existing studies have consistently reported that cognitive load decreases time domain measures (mean IBI, SDNN, and RMSSD) and HF while increasing LF and LF/HF (Tjolleng et al., 2017; Mehler et al., 2009, 2012; Wood et al., 2002; Brookhuis and De Waard, 2001).
An artificial neural network (ANN) model using ECG signals for the detection of the driver's cognitive load has shown better performance than other classification models. For instance, Zhang et al. (2014) developed a regression model to detect a cognitive load and showed an accuracy of 62.5%. In addition, Solovey et al. (2014) established several classification models such as decision tree method and logistic regression method, which had accuracies ranging from 71.5 to 74.1%. On the other hand, Tjolleng et al. (2017) proposed an ANN model of detecting a cognitive load during simulated driving and reported accuracies of 95% and 82% for learning and testing data. These superior classification performance of the ANN classifier is reasonable since it is capable to extract information from noisy data, avoid overfitting, and also more robust than other methods (de Naurois et al., 2019; Dong et al., 2011).
An accurate real-time detection system of driver's cognitive load is needed to provide timely interventions on the early onset of cognitive load. However, there are rooms to improve existing approaches in terms of accuracy and practicality. Since detecting driver's status using physiological signals is a challenging task due to existence of individual variability, accuracies of the existing approaches were varied largely (e.g., 62.5~95%). In addition, only few studies attempted to develop a real-time detection system of driver's cognitive load. However, they showed two limitations in terms of accuracy and detection delay. For example, Rigas et al. (2011) proposed a real-time detection system of driver's cognitive load using ECG, electrodermal activity, and respiration based on Bayesian network with accuracy of 82%. Liao et al. (2016) developed a real-time detection system of driver cognitive load based on eye movement and driving performances using support vector machine (SVM) and reported detection delay up to 9 seconds.
The purpose of this study was to develop a real-time detection system of driver's cognitive load using a multi-layer artificial neural network (MANN) on ECG signals. The MANN model was constructed using the ECG signals measured for 22 male participants under two simulated-driving conditions (1: normal driving, 2: overload driving). The proposed real-time detection system was coded in Matlab (MathWorks, Inc. USA) using the MANN model. The usefulness of the developed system was evaluated for two male participants who operated a driving simulator under the two different conditions.
2.1 Acquisition of ECG data sets
2.1.1 Experiments
We acquired two ECG data sets under different levels of driving speed (60km/h, 100km/h) and different impose methods of cognitive load (arithmetic task and two-back task). The first ECG data set was obtained for 9 male participants (mean age ± SD: 23.6±1.4 years). They had no discomfort on the day of experiment and signed an informed consent form. They were given an explanation about the experimental purposes and procedures. Driving conditions were defined as 1) normal driving or 2) overload driving. In the normal driving, the participant was asked to drive on a two-lane highway at a speed of about 60km/h for 2 minutes. In the overload driving, the participant did driving on the same two-lane highway at a speed of about 60km/h (primary task) for 2 minutes while performing an arithmetic task (secondary task). The arithmetic task was to do subtraction or addition of a 3-digit random number with a 1-digit random number. An arithmetic task program coded in Visual Basic 6.0 (Microsoft Inc., USA) randomly provided an arithmetic task to the participant, and he verbally reported his correct answer.
The second ECG data set was obtained from our previous study (Tjolleng et al., 2017), which measured 13 male participants (mean age ± SD: 26.3±2.7 years) while driving a simulator (primary task) with/without a two-back task (secondary cognitive task). Driving conditions were also defined as 1) normal driving or 2) overload driving. In the normal driving, the participant drove on a two-lane highway at a speed of about 100km/h for 2 min. In the overload driving, the participant drove on the same track, speed, and duration while performing a two-back task. The two-back task was to recall the two step's earlier number when the experimental computer presented arbitrary numbers with an interval of one second by referring from the existing studies (Hong et al., 2014; Mehler et al., 2011).
2.1.2 Data pre-processing and selection of sensitive ECG measures
We combined the two ECG data sets and pre-processed it according to the two-step protocol proposed in Tjolleng et al. (2017). In the first step, six ECG measures in time domain (mean IBI, SDNN, and RMSSD) and frequency domain (LF, HF, and LF/HF) were quantified for the combined ECG signals. IBI data were quantified from the raw ECG signals using the R-peak detection algorithm (Billauer, 2012) with windowed filter coded in Matlab. The three-time domain measures were quantified using Equation 1-3. Meanwhile, the three frequency domain measures were obtained by fast Fourier transform (FFT) algorithm. The frequency bands for LF (0.04~0.15Hz; unit: ms2) and HF (0.15~0.4Hz; unit: ms2) were defined according to Tarvainen et al. (2014). In addition, the window size adopted in this study was 120 seconds. In the second step, the six ECG measures were normalized with the ECG measures for the normal driving in order to eliminate the individual differences existing in the ECG signals (Hong et al., 2014; Lee et al., 2010; Lal and Craig, 2001).
Mean IBI=
where: n = number of inter-beat intervals, inter-beat interval
SDNN=
where: n = number of inter-beat intervals, inter-beat interval,
= average of inter-beat intervals
RMSSD=
where: n = number of inter-beat intervals, inter-beat interval
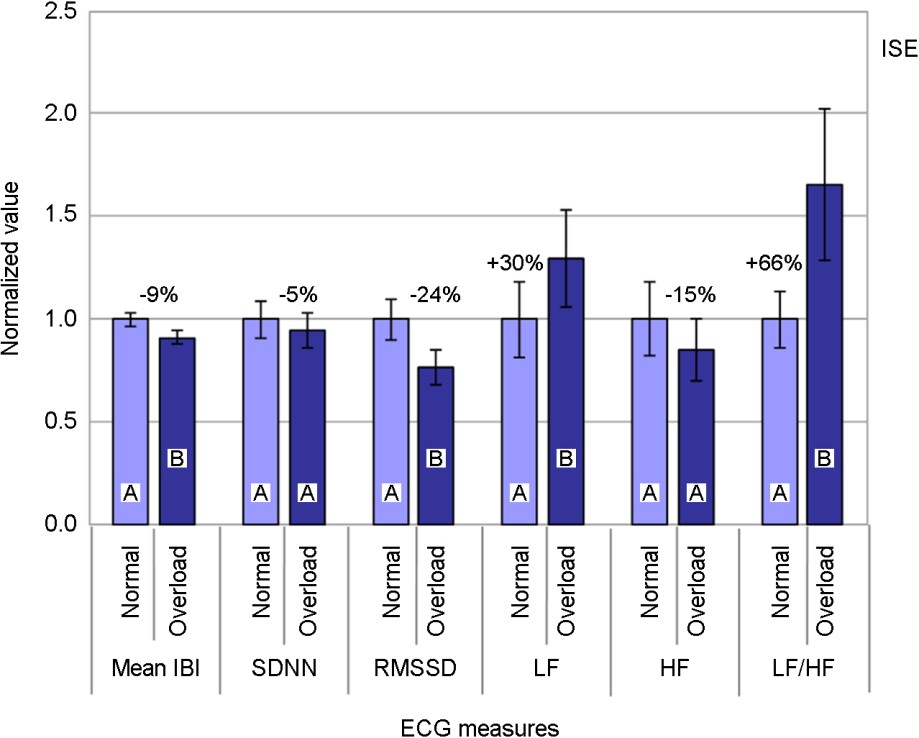
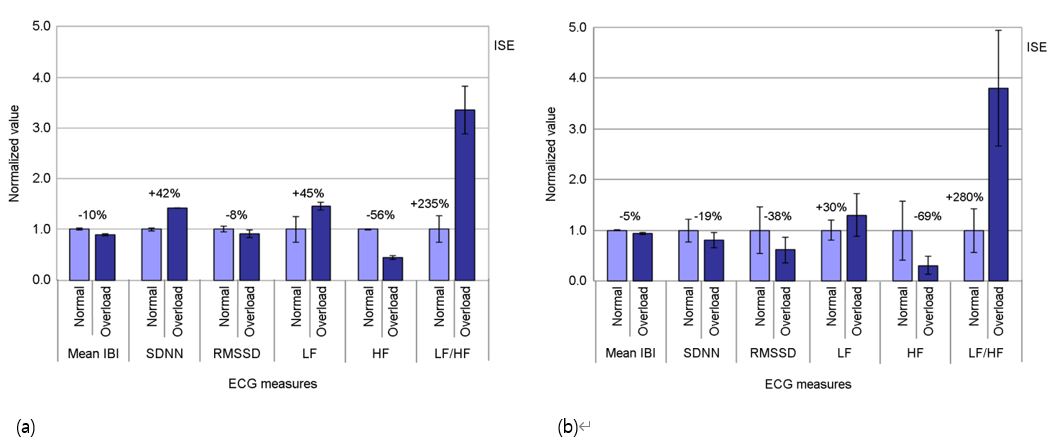
Two sensitive measures (mean IBI and RMSSD) out of six were selected by considering statistical significance and repeatability. An analysis of variance (ANOVA) was conducted in Minitab v14.0 (Minitab Inc., USA) to statistically examine the significance of the ECG measures as the driver's status changed (α = 0.05). The analysis results revealed that mean IBI, RMSSD, LF, and LF/HF measures showed significant trends in response to the change of driver's condition from normal to overload driving as shown in Figure 1 (mean IBI: F(1, 21) = 31.48, p < 0.001; RMSSD: F(1, 21) = 31.72, p < 0.001; LF: F(1, 21) = 4.70, p = 0.042; and LF/HF: F(1, 21) = 8.11, p = 0.010). All time domain measures and HF decreased as the driver condition changed; meanwhile, LF and LF/HF increased. Although SDNN and HF showed systematic trend with elevation of cognitive load, they were not statistically significant (SDNN: F(1, 21) = 3.70, p = 0.068; HF: F(1, 21) = 0.59, p = 0.452). On the other hand, standard deviations of the time domain measures (mean IBI = 0.16, SDNN = 0.41, RMSSD = 0.43) were relatively smaller than those of the frequency domain (LF = 0.98, HF = 0.79, LF/HF = 1.20).
2.2 Establishment of multi-layer artificial neural network
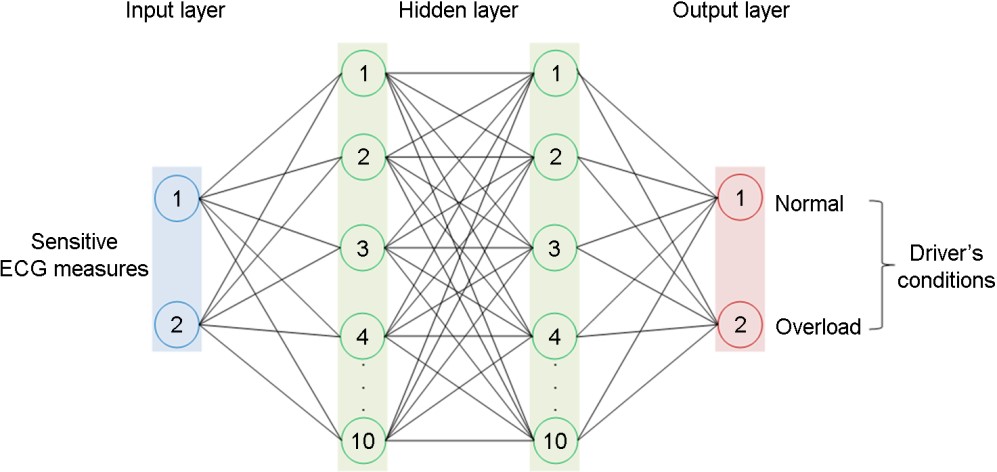
To classify the driver's status into either normal or overload, we proposed a MANN model consisted of four layers (one input, two hidden, and one output layers), as depicted in Figure 2. The input layer had two nodes for the two normalized sensitive ECG measures. The two hidden layer had 10 neurons each and was activated by a sigmoid function (tan-sigmoid transfer function) with output range [-1,1]. Lastly, the output layer had two nodes which were associated with the two driver's states (normal and overload).
A standard feed-forward and back-propagation neural network model was trained in Matlab (MathWorks, Inc. USA). The scaled conjugate gradient algorithm was utilized as a learning function of the back-propagation method. The normalized sensitive ECG measures obtained from the 22 participants were randomly partitioned into training (70%) and testing (30%) data sets. The training data was used during the network training and for adjusting unit of weights of the connection layers. Meanwhile, the testing data set was used to independently evaluate the network performance. The classification performances of the MANN model were evaluated using overall accuracy, specificity, and sensitivity for both of training and testing data sets. As a result, the MANN model showed perfect accuracy (100%), sensitivity (100%), and specificity (100%) for both of the training and testing data sets.
2.3 Implementation of the real-time detection system
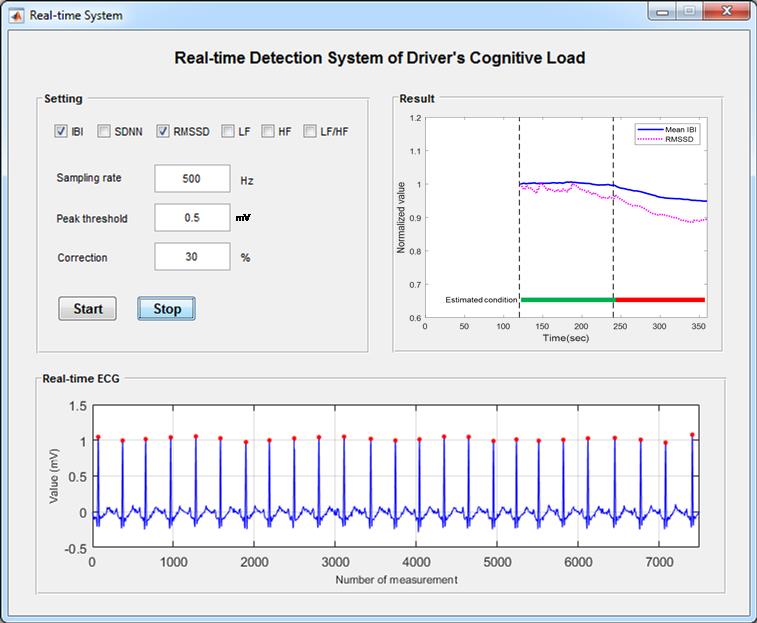
The study developed a real-time detection system consisted of an ECG device (hardware) and analysis software. The ECG device (Physiograph P400, PhysioLab Co., South Korea) measured ECG signals from a driver in real-time at a sampling rate of 500Hz. The analysis software comprised of three modules (ECG measure calculation module, driver's status classification module, and graphical user interface (GUI) module). The ECG measure calculation module quantified and normalized the two sensitive ECG measures using the ECG signals recorded for the initial 2 minutes. In addition, the peak threshold to detect R-peak points needed to be customized for each participant due to the magnitudes of ECG raw signals varied significantly among participants. The outlier criterion was also used to eliminate the outliers of IBI that were greater or less than the criterion percentage of previous IBI (e.g., 30%). The driver's status classification module classified the driver's status into either normal or overload using the MANN model. The window span and update rate of the real-time detection system were 120 seconds and 1 second, respectively. Lastly, the GUI module displayed the analysis results on a screen, as shown in Figure 3. The GUI module displayed all parameters (top-left of Figure 3), raw ECG signals (bottom of Figure 3, and classification result (top-right of Figure 3) for research purposes.
3.1 Methods and materials
3.1.1 Participants
Two young male participants (mean age ± SD: 27.0±1.41 years) voluntarily took part in the evaluation experiment of the real-time detection system. The participants were healthy, had a normal or corrected-to-normal vision, and without cardiovascular diseases. In addition, the participants asked to refrain from any alcohol and caffeine prior participating in the main experiment of this study. They signed an informed consent form and were given a description of the experimental objective and procedures.
3.1.2 Equipment
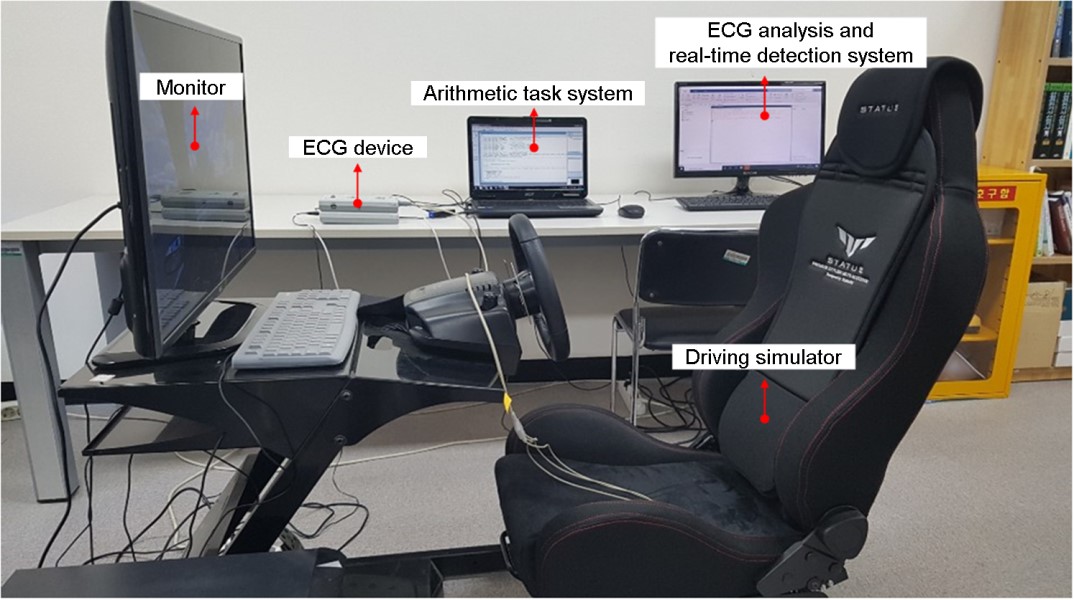
A driving simulator (Logitech G27 DriveTM, Switzerland) and a driving program (Driving Simulator 2012, Excalibur Publishing Ltd., UK) were used in this study. The driving simulator was comprised of a seat, a steering wheel, and two pedals for acceleration and brake (Figure 4). The driving program was used to provide a driving scene. A desktop computer (Model ST2410b Dell, China) was used for simulated driving by connecting the driving simulator with the driving program. A notebook computer (Aspire 5732Z, Acer Inc., China) was employed to execute the arithmetic task system for inducement of driver cognitive load. Lastly, a desktop computer (Model Flatron 24EN43V, LG Electronics Inc., Korea) was also utilized for the detection system, which recorded the ECG signals and displayed the classification results in a real-time.
3.1.3 Experimental design
To validate the effectiveness of the real-time detection system, an experiment was carried out under two different driving conditions (normal and overload driving). In the normal driving, the participant drove on a two-lane highway at a speed of about 60km/h. The overload driving involved driving on the same two-lane highway at a speed of about 60km/h (primary task) while performing an arithmetic task as a secondary task.
The experiment was divided into two sessions: 1) pre-experiment session and 2) main experiment session. In the first session, a pre-experiment was performed to collect the ECG signals for the participant while operating the simulator under two different driving conditions. These ECG signals were used to confirm two sensitive ECG measures of the participant. The pre-experiment was performed in three steps. First, the participant was explained the objective of the pre-experiment. Second, three ECG sensors were placed on the driver's wrists and right ankle before a practice trial was carried out for about 5 minutes to become accustomed with the driving simulator. Lastly, the participant was instructed to drive under the two driving conditions for 2 minutes each. The pre-experiment was conducted two times (one in the morning and one in afternoon on the same days). The experiment order of the driving conditions was counterbalanced.
In the next session, the main experiment was conducted to evaluate the real-time detection system for the same person who participated in the first session. The main experiment was performed with the following five steps. First, the participant was informed of the objective of the main experiment. Second, three ECG sensors were attached to the participant, and a short practice drive was allowed for about 5 minutes. Third, the two sensitive measures selected from the pre-experiment were input into the real-time detection system. Next, the baseline for the participant was measured under normal driving for 2 minutes. Fourth, the participant was instructed to drive under normal and overload driving conditions for 2 minutes each while the ECG signals were recorded. The ECG signals were processed by the real-time detection system, and the analysis results were displayed on a screen in real-time. Lastly, a short debriefing was conducted regarding the experimental results.
3.2 Results
Two sensitive ECG measures (mean IBI and RMSSD) for both participants were the same as described in chapter 2.1.2. For example, the participant #1 in Figure 5a showed change directionality agreeing with the results of previous studies (Tjolleng et al., 2017; Mehler et al., 2009, 2012; Wood et al., 2002; Brookhuis and De Waard, 2001), except SDNN. In general, the time domain measures showed smaller standard deviations than the frequency domain measures as shown in Figure 5a and 5b.
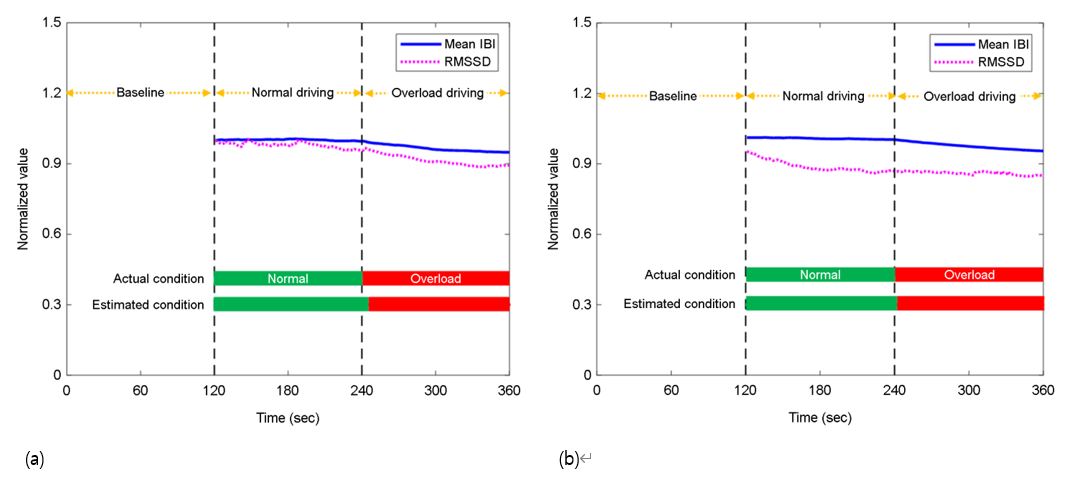
The proposed real-time system using the two sensitive measures detected a status change as the driving condition changed from normal to overload, as shown in Figure 6. It can be observed that the normalized mean IBI and RMSSD of the both participants gradually decreased after the driving condition changed at the time 240 seconds. For example, the normalized mean IBI and RMSSD of the participant #1 were 0.99 and 0.91 for the normal driving and 0.87 and 0.75 for the overload driving, respectively.
Although the real-time detection system correctly identified the status change of the both participants, some delays were observed until detecting the status change, as shown in Figure 6. In this study, the driving condition changed at 240 seconds which was the right after the normal driving (time to start the secondary task); however, the real-time detection system detected the status change at 246 seconds for the participant #1, which indicates a delay of 6 seconds. Similarly, for the participant #2, the real-time detection system identified the status change at 243 seconds, which corresponds to a delay of 3 seconds. The average of time delay for both participants were 4.5 seconds.
The present study developed a real-time detection system that can detect driver's cognitive load using the MANN on ECG signals. The MANN model to classify the driver's status into either normal or overload was constructed using the ECG signals measured for 22 participants. The ECG signals were normalized within each participant, and two sensitive ECG measures were selected to account for individual differences (Hong et al., 2014; Lee et al., 2010; Lal and Craig, 2001). This study demonstrated the usefulness of the real-time detection system in a simulator-based driving experiment for two new participants.
In the performance evaluation of the real-time detection system, the average changing trend of all ECG measures (except SDNN for participant #1) due to the cognitive load obtained in this study agreed with the results reported in previous studies. Mean IBI and RMSSD in the time domain decreased when the participants were driving under a cognitive load. These trends agree with the results of Tjolleng et al. (2017), Brookhuis and De Waard (2001), and Wood et al. (2002). In addition, LF and LF/HF increased and HF decreased when the participants drove under a cognitive load in the study. These trends also agreed with the results obtained by Wood et al. (2002) and Tjolleng et al. (2017).
The MANN model with two hidden layers adopted in this study showed a better accuracy compared to the typical ANN model with a single hidden layer used in our earlier work (Tjolleng et al., 2017). The accuracies of the MANN and ANN models for the training data set were 100% and 95%, respectively. Similarly, the accuracies for the testing data set were 100% and 82%. These results indicated the effectiveness of the proposed MANN model in detecting the status of driver's cognitive load based on ECG signals. The reason for the result can be explained in relation to the fact that a deeper network such as MANN can capture more complex nonlinear relationships in the data (Zhang et al., 2019).
The real-time detection system detected the status change with some delays (mean delay = 4.5 seconds) for both participants. This can be explained by the effect of transition period and time window used in this study. First, the delay observed in the detection system might be affected by the transition condition from the normal driving to the overload driving condition. Second, this study adopted a time window of 120 seconds, as suggested by Tjolleng et al. (2017). Thus, the ECG measurements calculated at the moment of the status change reflect the 120 seconds before the status change. To examine the effect of the time window on detectability, a comprehensive follow-up study with a large group of participants is necessary.
The real-time detection system in this study demonstrated its usefulness in identifying the driver's cognitive load. Thus, the detection system can be applied to develop an intelligent vehicle that can support a driver by providing timely interventions and/or warnings to prevent vehicle accidents and near-accidents. However, several limitations need to be reflected in further studies to generalize the findings of this study. First, since the experiments in this study were limited in terms of sample size and demographic characteristics of the participants, further experiments are suggested involving large samples with diverse demographic characteristics such as age, gender, and population. Second, this study mainly focused on detection of two levels of driver's states of cognitive load (normal or overload). Hence, future works are suggested to explore other types of driver's states (e.g., drowsiness and fatigue). Lastly, the experiments of this study were conducted in a laboratory with controlled condition using a driving simulator due to safety issues. Thus, a field study with a real vehicle is necessary to validate the results of this study.
This study proposed a real-time detection system of driver's cognitive load using a MANN model based on ECG signals. The MANN model was established based on the ECG signals measured from 22 participants while driving under two different conditions (normal driving, overload driving). An experiment was performed with two participants who operated a driving simulator under the two different conditions to examine the effectiveness of the developed real-time detection system. The results of this study showed that the real-time detection system enabled to correctly classify the both participant's status into either normal or overload. We expected that the proposed real-time detection system of driver's cognitive load can be applied for the development of an intelligent vehicle in order to prevent vehicle accidents.
References
1. Billauer, E. Peak detection using MATLAB. http://www.billauer.co.il/peakdet.html, 2012 (Retrieved July 20, 2012).
2. Brookhuis, K.A. and De Waard, D., Assessment of drivers' workload: performance, subjective and physiological indices. In Hancock, P. and Desmond P. (Eds.). Stress, Workload and Fatigue: Theory, Research and Practice, Lawrence Erlbaum, New Jersey, 2001.
Google Scholar
3. de Naurois, C.J., Bourdin, C., Stratulat, A., Diaz, E. and Vercher, J.L., Detection and prediction of driver drowsiness using artificial neural network models. Accident Analysis & Prevention, 126, 95-104, 2019.
Google Scholar
4. Dong, Y., Hu, Z., Uchimura, K. and Murayama, N., Driver inattention monitoring system for intelligent vehicles: A review. IEEE Transactions on Intelligent Transportation Systems, 12(2), 596-614, 2011.
Google Scholar
5. Hong, W., Lee, W., Jung, K., Lee, B., Park, J., Park, S., Park, Y., Son, J., Park, S. and You, H., Development of an ECG-based assessment method for a driver's cognitive workload. Journal of the Korean Institute of Industrial Engineers, 40(3), 325-332, 2014.
6. Kountouriotis, G.K., Spyridakos, P., Carsten, O.M. and Merat, N., Identifying cognitive distraction using steering wheel reversal rates. Accident Analysis & Prevention, 96, 39-45, 2016.
Google Scholar
7. Lal, S.K.L. and Craig, A., A critical review of the psychophysiology of driver fatigue. Biological Psychology, 55, 173-194, 2001.
Google Scholar
8. Lee, W., Jung, K., Hong, W., Park, S., Park, Y., Son, J., Park, S. and Kim, K., "Analysis of drivers' ECG biological signal under different levels of cognitive workload for intelligent vehicle", Proceedings of the 2010 Fall Conference of Ergonomics Society of Korea, 2010.
9. Li, P., Markkula, G., Li, Y. and Merat, N., Is improved lane keeping during cognitive load caused by increased physical arousal or gaze concentration toward the road center? Accident Analysis & Prevention, 117, 65-74, 2018.
Google Scholar
10. Liao, Y., Li, S.E., Li, G., Wang, W., Cheng, B. and Chen, F., "Detection of driver cognitive distraction: An SVM based real-time algorithm and its comparison study in typical driving scenarios". In 2016 IEEE Intelligent Vehicles Symposium (IV) (pp. 394-399), IEEE, 2016.
Google Scholar
11. Mehler, B., Reimer, B., Coughlin, J.F. and Dusek, J.A., "The impact of incremental increases in cognitive workload on physiological arousal and performance in young adult drivers", Proceedings of Transportation Research Board 88th Annual Meeting, 2009.
Google Scholar
12. Mehler, B., Reimer, B. and Dusek, J.A., MIT AgeLab delayed digit recall task (n-back). MIT AgeLab White Paper Number 2011-3B. Cambridge, MA, Massachusetts Institute of Technology, 2011.
Google Scholar
13. Mehler, B., Reimer, B. and Coughlin, J.F., Sensitivity of physiological measures for detecting systematic variations in cognitive demand from a working memory task: an on-road study across three age groups. Human Factors, 54(3), 396-412, 2012.
Google Scholar
14. National Highway Traffic Safety Administration (NHTSA)., Distracted driving 2015, NHTSA, USA, 2017.
15. Piotrowski, Z. and Szypulska, M., Classification of falling asleep states using HRV analysis. Biocybernetics and Biomedical Engineering, 37(2), 290-301, 2017.
Google Scholar
16. Reimer, B., Donmez, B., Lavallière, M., Mehler, B., Coughlin, J.F. and Teasdale, N., Impact of age and cognitive demand on lane choice and changing under actual highway conditions. Accident Analysis & Prevention, 52, 125-132, 2013.
Google Scholar
17. Rigas, G., Goletsis, Y. and Fotiadis, D.I., Real-time driver's stress event detection. IEEE Transactions on Intelligent Transportation Systems, 13(1), 221-234, 2011.
Google Scholar
18. Sahayadhas, A., Sundaraj, K. and Murugappan, M., Drowsiness detection during different times of day using multiple features. Australasian Physical and Engineering Sciences in Medicine, 36(2), 243-250, 2013.
Google Scholar
19. Solovey, E.T., Zec, M., Garcia Perez, E.A., Reimer, B. and Mehler, B., "Classifying driver workload using physiological and driving performance data: Two field studies", Proceedings of the 32nd annual ACM conference on Human factors in computing systems (pp. 4057-4066), 2014.
Google Scholar
20. Tarvainen, M.P., Niskanen, J.P., Lipponen, J.A., Ranta-Aho, P.O. and Karjalainen, P.A., Kubios HRV-heart rate variability analysis software. Computer Methods and Programs in Biomedicine, 113(1), 210-220, 2014.
Google Scholar
21. Tjolleng, A., Jung, K., Hong, W., Lee, W., Lee, B., You, H., Son, J. and Park, S., Classification of a Driver's cognitive workload levels using artificial neural network on ECG signals. Applied Ergonomics, 59, 326-332, 2017.
Google Scholar
22. Wood, R., Maraj, B., Lee, C.M. and Reyes, R., Short-term heart rate variability during a cognitive challenge in young and older adults. Age and Aging, 31, 131-135, 2002.
Google Scholar
23. Zeeb, K., Buchner, A. and Schrauf, M., Is take-over time all that matters? The impact of visual-cognitive load on driver take-over quality after conditionally automated driving. Accident Analysis & Prevention, 92, 230-239, 2016.
Google Scholar
24. Zhang, H., Zhu, Y., Maniyeri, J. and Guan, C., "Detection of variations in cognitive workload using multi-modality physiological sensors and a large margin unbiased regression machine", In Engineering in Medicine and Biology Society (EMBC), 2014 36th Annual International Conference of the IEEE (pp. 2985-2988), 2014.
Google Scholar
25. Zhang, Y., Fitch, P., Vilas, M.P. and Thorburn, P.J., Applying multi-layer artificial neural network and mutual information to the prediction of trends in dissolved oxygen. Frontiers in Environmental Science, 7, 46, 2019.
Google Scholar
PIDS App ServiceClick here!