eISSN: 2093-8462 http://jesk.or.kr
Open Access, Peer-reviewed
eISSN: 2093-8462 http://jesk.or.kr
Open Access, Peer-reviewed
Youngeun Roh
, Younghwan Pan
10.5143/JESK.2021.40.5.283 Epub 2021 November 01
Abstract
Objective: This study explores methods of enhancing inclusion in financial design to benefit the financially disadvantaged.
Background: Since the global financial crisis, 'Financial inclusion' has emerged as economic and social inequality has required social responsibility of the financial industry. However, financial services for the poor are provided temporary. To overcome the limitations of these problems. This study has been implemented to financial service through inclusive design.
Method: Through a preliminary study on universal design and creating shared value (CSV), inclusive design (ID) is redefined into eight principles that encompasses social and economic values. Furthermore, 27 inclusive design for financially disadvantaged (IDF) items were derived from the ID principles through financial service case analysis and expert interviews. To investigate the relationship between the importance and perception of ID according to IDF, a survey was conducted with three financially disadvantaged groups and one general group (305 participants in total).
Results: ANOVA analysis, 'Safety' was considered as the most important principle, whereas 'Value' was considered as the least important. Although the mean values of the eight principles were similar between the groups, there were notable differences between the four groups regarding the importance of eight IDF items. Factor analysis, all groups assembled the eight ID principles into four concepts. Notably, all groups associated 'Inclusivity' with 'Ease of Use'. However, there were differences between the groups in the concept perceived of the six principles.
Conclusion: Through this study, it was found that the ID principles had the potential to help realize financial inclusion. Further in-depth financial design studies will be required to take into consideration a wider variety of users and financial circumstances.
Application: Research regarding the inclusiveness of financial design aims to ensure the financially disadvantaged can access and use financial services without restrictions.
Keywords
Inclusive design Financial design Inclusion Financially disadvantaged
Following the global financial crisis (2007-2008), many turned to strengthening public roles in financial services (Oh et al., 2017). According to the World Bank (Demirguc-Kunt et al., 2017), approximately 1.7 billion adults around the world did not have 'access' to transaction accounts in 2017. 'Financial inclusion' was introduced by the United Nations in the early 2000s, yet state-led financial support and small loan policies for low-income families have had little to no effect on poverty (Oh et al., 2017; Bateman, 2012).
Under such circumstances, the financial industry has developed data processing technologies with the advancement of science and technology and has enhanced the efficiency of financial services by reducing financial brokerage fees and diversifying risks (An et al., 2018). The continuous development of technology has brought about significant changes, such as the widespread use of smartphones and the emergence of the MZ generation. However, the proliferation of fintech has given rise to a new financially disadvantaged population due to the closure of offline branches, limited use of cash, and inequal access to financial information (Oh et al., 2017; Shin, 2021).
'Inclusive business models' have been raised as solutions to the policy and technical limitations of the financial industry. To fundamentally solve the issue of poverty among the financially disadvantaged, the characteristics of such income groups should be subcategorized to develop tailored financial services. Such services can enable the financially disadvantaged to maintain continuous economic participation and a basic standard of living (Oh et al., 2017).
Although significant effort is being focused on policy, technological, and economic research regarding financial inclusion, there is a need to conduct alternative research that aims to strengthen the connection between people and financial services. Given the need to transition from supply-side problem solving to the demand-side perspective, it was deemed appropriate to study the subject from the perspective of user-centered design. To provide sustainable financial services, it is key to view the economic benefits and social responsibilities of the financial industry with equal importance. Therefore, this study focuses on the concept of 'inclusive design (ID)' to explore 'inclusive design for financially disadvantaged (IDF)'.
1.1 Theoretical study
1.1.1 Financial inclusion and the financially disadvantaged
In 2010, the G20 adopted 'financial inclusion' as one if its agendas, and the UN followed by establishing Sustainable Development Goals (SDGs) on the matter in 2013. According to the 'G20 Principles for Innovative Financial Inclusion', the principles regarding the financially disadvantaged are 'diversity', 'in-novation', 'protection', and 'empowerment'. The goal is to stimulate competition between various services to grant the financially disadvantaged better access to financial systems and promote technological and institutional innovations. The principles also aimed to promote holistic approaches regarding financial consumer protection as well as further develop financial literacy and competency. Principles related to the policy/regulatory/advisory roles of governments and institutions were excluded (Oh et al., 2017; GPFI).
According to a global study by CGAP (Kilara and Rhyne, 2014), financially disadvantaged individuals believe the utilization of public financial services incurs significant monetary costs, requires significant time investment, and result in mental stress (Kilara et al., 2014). Furthermore, the Global Findex of the World Bank found that a lack of trust in financial institutions is the main reason people avoid using public financial institutions (Demirguc-Kunt et al., 2013). In 2017, the British Financial Conduct Authority (FCA) conducted a 'Financial Lives Survey' to better understand consumer behavior in financial markets. The survey found that 'a lack of financial resilience', 'negative life events with large ripple effects', 'low financial capacity', and 'health status' were causes that could negatively affect one's financial situation, and these were defined as 'potential vulnerabilities' (Byeon, 2019; Authority, 2017).
In the case of Korea, the Financial Supervisory Service (FSS) found in a 2019 survey that the low-income/low-credit class and groups excluded from institutional financial systems consisted of 'thin filers': people entering the workforce, homemakers, and the elderly without credit card records within the past two years or loan records within the past three years. According to the credit evaluation data of NICE GROUP, 27% of all individuals with credit ratings (approximately 13 million people) as of late June 2020 fell in the thin filer category.
According to a research report published by the National Information Society Agency (NIA), the adoption rate of digital and information technology in Korea (when compared to the general population) is 71.4% for the elderly, 76.9% for rural citizens, 81.4% for the disabled, and 96.1% for the low-income class. In terms of occupation, homemakers, farmers, fishermen, the unemployed, and other low-income individuals use digital and information technology to a lesser degree compared to the general public, professionals, or students. Additionally, the adoption rate of online financial transaction services is lower for older groups, as highlighted by the adoption rate data by age: 72.3% for people in their 20s, 70.6% for people in their 30s, 63.4% for people in their 40s, 51.6% for people in their 50s, and 40.9% for people aged 60 and above (Shin, 2021; MSIT and NIA, 2020).
1.1.2 Redefining ID principles
Facing the looming issue of a super-aged society, Northern European countries proposed various design principles for the disabled in the 1960s. American architect Ronald L. Mace defined 'universal design (UD)' as "the design of products and environments to be usable by all people, to the greatest extent possible, without the need for adaptation or specialized design". With the core value of 'equality', Mace developed 'the 7 Principles of Universal Design' with various industrial and environmental designers. The principles are as follows: 'equitable use', 'flexibility in use', 'simple and intuitive use', 'perceptible information', 'tolerance for error', 'low physical effort', and 'size and space for approach and use' (NCSU, 1997).
In 1995, Roger Coleman proposed the concept of inclusive design, which started with the discovery of situations where individuals with visual/hearing impairments were excluded from digital environments. Due to the demographic changes arising from aging, the elderly population has become an essential subject of mainstream design. Product innovations stemming from 'inclusiveness' not only increase commercial profitability but also act as a gateway to a more user-friendly future (Coleman, 1994; Clarkson and Coleman, 2015; Inclusive Design Research Center, OCAD; Design Council, 2014).
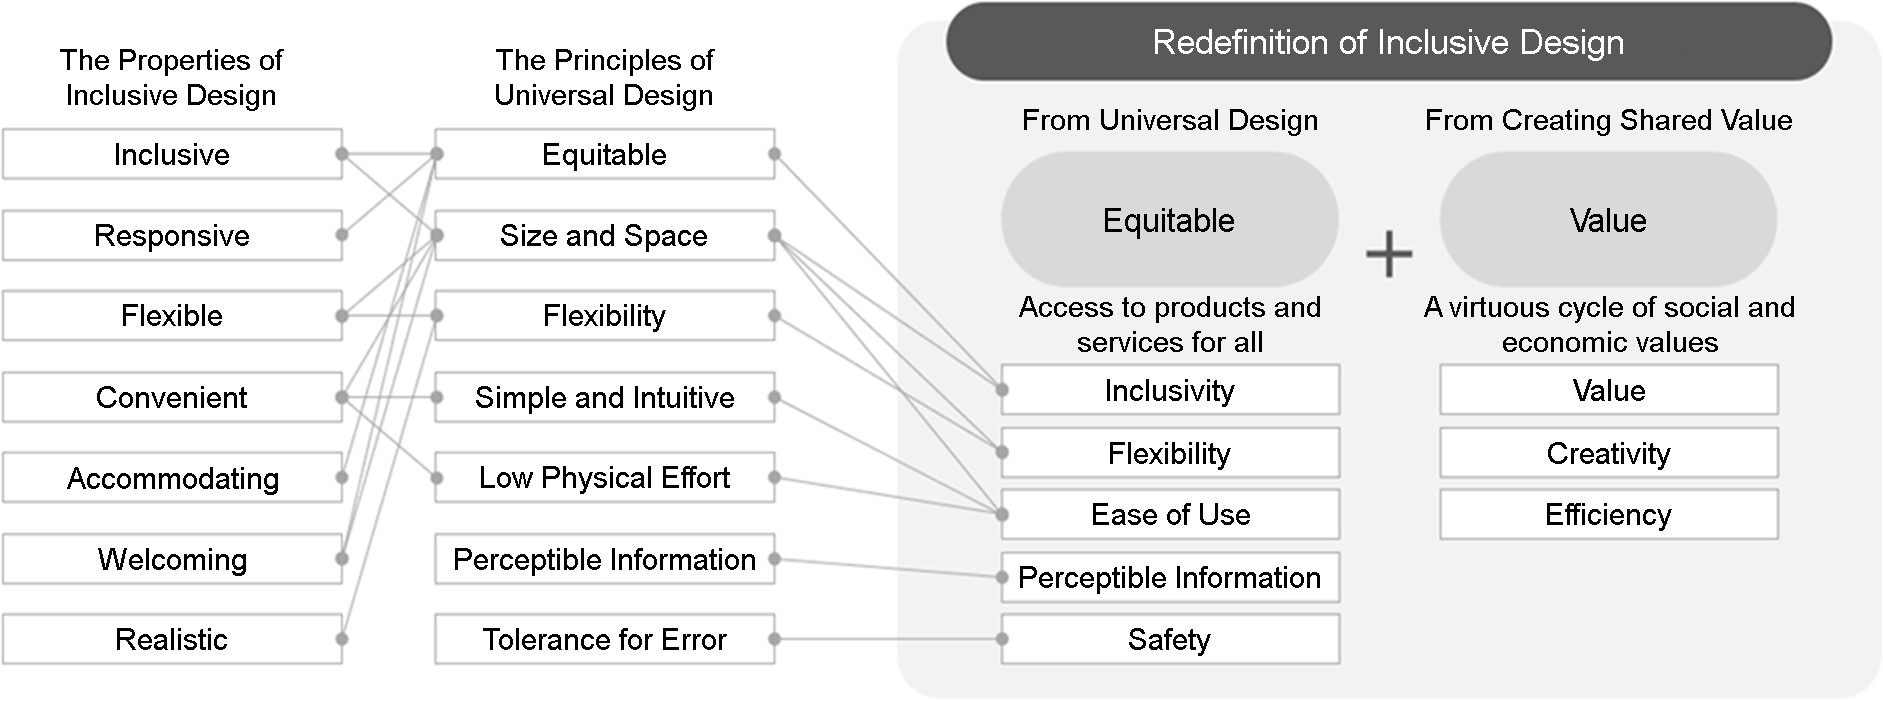
ID is a concept that developed from UD by also incorporating business considerations. An example of an ID strategy is the 'Inclusive Design Cube' (Clarkson and Coleman, 2015). In addition, the British Design Council Commission for Architecture and the Built Environment (CABE) defines five 'principles of inclusive design' and present seven underlying properties of ID: 'inclusive', 'responsive', 'flexible', 'convenient', 'accommodating', 'welcoming', and 'realistic' (Design Council, 2014).
According to a comparative study between UD and ID by P.J. Clarkson and T.S. Kim, UD is public-oriented design that aims to build a society of coexistence between the strong and weak by considering the disabled, elderly, and disadvantaged individuals, whereas ID is design for everyone that considers the needs of all members of society, whether they are disabled or not (Clarkson and Coleman, 2015; Kim, 2015). In other words, ID has a broader definition from the user and economic perspectives (Edward and Jordana, 2012; Kim, 2015). UD, being the original design concept that centered around social responsibility, is an idealistic concept for solving inequality that faces many limitations when applied to the real world. One could say that ID is the result when the UD concept is combined with user-centered design from the discipline of human-computer interaction, however, it is unable to fully incorporate the aforementioned economic considerations. Such limitations are overcome by redefining the principles of ID through the introduction of 'creating shared value (CSV)', a business concept that simultaneously considers social responsibility and economic value.
CSV is a concept first proposed in 2011 by Michael E. Porter and Mark Kramer. CSV is a business model that simultaneously creates economic and social value to increase the total shared value - the approach connects the positive social change (social progress) induced by a company's actions to increased business value (corporate performance) (Porter and Kramer, 2011; Kramer and Pfitzer, 2016). CSV is split into three stages: the first stage reconceives products and markets, the second stage redefines productivity/efficiency in the value chain, and the last stage proposes the formation and development of regional clusters. The core aspects of the CSV strategy are 'reconceiving' and 'transforming the value chain'. Although large companies will require significant amounts of initial investment, competitiveness can be enhanced by improving the productivity/efficiency of supply structures through the establishment of industrial clusters. Small-scale local producers can gain competitiveness and maintain economic activity through shared growth with the local community. Additionally, by encouraging consumers to adhere to ethical consumption behavior, it is possible to bring about meaningful changes in industries and the society as a whole (Porter and Kramer, 2011; Shin, 2013).
In this study, ID is redefined as 'design that aims to ensure that every individual, including those part of marginalized groups from a demographic or economic standpoint, has full access to products and services without discrimination and are able to circulate social and economic value'. By comparing the seven core principles of UD - the origin of the ID concept - with the seven properties of ID, five core values were derived: 'Inclusivity', 'Flexibility', 'Ease of Use', 'Perceptible Information', and 'Safety'. Furthermore, three roles of design were derived from the CSV concept: the 'Value' of design that brings about a virtuous cycle of social value through economic activity, the 'Creativity' of design to open new markets, and the 'Efficiency' of design that maintains regional clusters and ensures sustainable production. The eight defined ID principles are described in Figure 1 and Table 1.
|
ID principles |
Source |
Description |
|
Inclusivity |
UD |
Design in a way that grants all types of people access to use
products and services regardless of their age, disabilities, or
social/economic positions |
|
Flexibility |
UD |
Design in diverse ways
with consideration of individual preferences and capabilities |
|
Ease of Use |
UD |
Design in a way that allows individuals to use products with ease
and minimal effort regardless of their abilities |
|
Perceptible |
UD |
Design information so that any individual can easily and clearly
understand it, regardless of their sensory capabilities or abilities |
|
Safety |
UD |
Design in a way that
maximizes safety by preventing errors or risks during use |
|
Value |
CSV |
Design in a way that
creates a virtuous cycle of social value stemming from economic activity |
|
Creativity |
CSV |
Provide improved designs through the creation of new markets where
there is unmet consumer and market demand |
|
Efficiency |
CSV |
Provide efficient designs
that maintain regional clusters and ensure sustainable production |
1.2 Financial inclusion case study
To study the inclusiveness of financial design based on the ID principles, a case study was conducted with cases in the financial industry that involve financial inclusion, as shown in Table 2. For the case study, 94 unicorn companies in the fintech sector in 2021, 100 companies included in 'Inclusive Fintech 50', other CSV/inclusion/financial innovation cases, and national financial inclusion cases were examined. In the end, services that solved the problems of conventional financial systems for the benefit of the financially disadvantaged were selected. In the case of overlapping services, we selected six companies that are showing steady growth (revenue/users/application downloads etc.) or are expanding their services by working with national institutions, other industry sectors, or non-governmental organizations (NGOs). The selected cases were chosen as the services, which were intended for the inclusion of the financially disadvantaged, were expanded to also benefit the general population, realizing the goal of ID.
|
Financial |
Transfer |
Exchange |
Personal loan |
Business loan |
Insurance |
Financial |
|
Service |
M-Pesa |
Revolut |
Earnin |
EthicHub |
Reach52 |
Money Smart Program |
|
Country |
UK, Kenya |
UK |
USA |
Spain |
Singapore |
USA |
|
Year of |
2007 |
2015 |
2014 |
2018 |
2017 |
2013 |
|
Performance |
Used by 46% of |
750,000 users in (as of 2020) |
Over 1 million |
240 profitable farmers over (as of 2021) |
Partnership with UNICEF Innovation |
43% of people without a checking account opened (as of 2007) |
The six services were analyzed based on the financial inclusion support method, which acts as the interface between suppliers and consumers. Support methods include the following: ① establishment of infra-structure, ② development of financial services, ③ financial education, ④ policy advice (Oh et al., 2017). ① and ② were combined under 'Service Features' from the supplier's perspective, whereas ③ and ④ were combined under 'Financial Protection and Support' from the public interest perspective. The analysis results are shown in Table 3.
|
Service |
Target user |
Service features |
Financial protection and support |
|
M-Pesa |
All users who have difficulty using conventional
financial services → Expanded to the general |
SMS bank transactions Withdrawals/payments
through Platform
for providing financial |
Low fees Support for asset building Financial fraud prevention Support
for service training |
|
Revolut |
Overseas student workers/international
students/travelers who have difficulty using financial services → Expanded
to the general public |
Currency
exchange/overseas Stock/cryptocurrency/gold Mobile banking and card issuance Discounts and rewards |
Low
currency Card fraud prevention Junior accounts Financial education for children Partnerships with charities |
|
Earnin |
All paid workers |
Mobile finance application services Wage
calculations based on Voluntary tip (fee) payments |
Prevention of overdraws Asset management support Community support Policy
proposals to improve access |
|
EthicHub |
Small coffee farms that have difficulty in
obtaining loans |
Mobile P2P loan service Direct online transactions Able to use cryptocurrencies |
Generate credit history Production management support Investor
protection and farm donations |
|
Reach52 |
Low-income rural areas that are |
Mobile application and kiosks Microinsurance
and diagnostic information Online
purchasing of health products |
Minimal
medical costs/insurance premiums Point system for healthy users Support
for the use of services and medical education |
|
Money Program |
Students, young adults, adults, elderly, small
business owners |
Free online learning resources Personalized training |
Free financial education Practical financial education |
|
Key |
- Solves problems faced by
disadvantaged groups -
Discovery of new markets - Expansion of services to the
general population - Services that meet the various
financial needs of consumers |
- Utilization of various forms
of infrastructure (online/devices/ -
Simplified sign-up procedures -
Features that are easy to learn -
Personalized services |
- Fosters asset
growth/management -
Support for risk prevention - Offers and utilizes financial
information/education - Encourages participation in
donations/sponsorships - Encourages financial policy
participation |
Expert interviews were conducted based on the key properties derived from the preliminary study and the case study of financial inclusion services. IDF items were derived according to the ID principles by analyzing the interview responses, and the importance of design was analyzed through surveys with financially disadvantaged participants.
2.1 Deriving financial design categories from expert interviews
In-depth 1:1 interviews were conducted with seven designers from the fintech sector with at least 10 years of design experience and at least 5 years of experience with UX design or product design projects. The research subject and case study were verified by the experts and their opinions regarding IDF were gathered. Key meaning units from the interviews were selected based on the 'grounded theory' qualitative research approach. A defining process was repeated and matched with the ID principles. Through the meaning unit analysis, 27 IDF items were derived according to the ID principles, as shown in Table 4. The IDF items were used to evaluate the importance of financial design for the financial disadvantaged.
|
ID principles |
Meaning unit (= IDF Items) |
Meaning unit selection |
|
Inclusivity |
IDF 1-1 Various Users IDF 1-2 Service Segmentation IDF 1-3 Ease of Discovery IDF 1-4 Ease of |
"Homemakers, children, and the elderly should be able to use
conventional financial services". "It is vital to target the financially disadvantaged through
segmentation". "It should be easy for users to quickly check if they are eligible
for a service, and if they are eligible, users should be able to easily apply
for and use the service". "We need to make it easier for people to learn about finance and
provide better access". |
|
Flexibility |
IDF 2-1 Offers Various Methods IDF 2-2 Utilization of Various Devices IDF 2-3 Flexible Design |
"The trend these days is to reduce the number of customer service
representatives and instead use chatbots. However, is this the right move?" "Although many people use apps, it should be possible to check my
balance on a PC". "It is important to design in a flexible manner by considering the
financial circumstances of various types of consumers". |
|
Ease of Use |
IDF 3-1 Ease of Use IDF 3-2 Universal Design IDF 3-3 Easily Understandable Functions/Information |
"Easy and convenient design is fundamental". "Users should be able to use services on their own. It would be
good if the services are similar to what the users generally use". "It should be easy to use regardless of the user's
level of financial knowledge". |
|
Perceptible Information |
IDF 4-1 Transparent Information IDF 4-2 Reliable Design IDF 4-3 Ease of Learning |
"Information should be conveyed using transparent language that the
customer can understand". "The design should help users believe financial information is
trustworthy". "Sometimes, it is necessary to provide opportunities to learn
complex financial terminology or information". |
|
Safety |
IDF 5-1 Stability IDF 5-2 Hazard Prevention IDF 5-3 Asset Forecasting IDF 5-4 Active Management IDF 5-5 Asset/Privacy Protection |
"It should be designed in a way that ensures stable operation". "Users should be notified immediately of any risks to their
financial situation". "Asset forecasting information should be designed so that users can
set asset plans". "We need to design functions and information that allow users to
consistently manage themselves". "We need to provide design elements that can help protect assets
and privacy". |
|
Value |
IDF 6-1 Meaningful Financial Activities IDF 6-2 Meaningful Financial Investments IDF 6-3 Participation in Financial Policy Reforms |
"It is preferable if fees and interest expenses are used to support
the disadvantaged". "Meaningful financial investments that grow with small
businesses/farmers are also important". "We need to be more active in bringing change to adverse financial
policies". |
|
Creativity |
IDF 7-1 Solving Problems IDF 7-2 New Financial IDF 7-3 New Financial Technologies |
"We need to find detailed solutions to financial problems". "The disadvantaged should be viewed as a new market, and so we need
to provide new experiences". "It is important to quickly identify reactions through the use of
new technologies". |
|
Efficiency |
IDF 8-1 Practical Functions IDF 8-2 Easy-to-operate Designs IDF 8-3 Design Quality Management |
"Features that customers need should be provided first". "Complicated services should be effectively managed by removing
unnecessary functions". "Quality needs to be improved equally through effective management". |
2.2 Survey planning and execution
An online survey was conducted as it was necessary to gather a wide range of responses from those who are financially disadvantaged. From the findings of the preliminary study, it was believed that there would be discrepancies between how financially disadvantaged individuals evaluated the importance of financial design depending on their income level, age group, or occupation. As such, the survey respondents were categorized into four groups: three financially disadvantaged groups - Group A (ages 20~29, 75 respondents in total), Group B (ages 30~59, 75 respondents in total), and Group C (ages 60 and above, 79 respondents in total) - and a control group consisting of individuals with general income levels - Group D (ages 30~59, 76 respondents in total). In terms of personal income level, based on the minimum wage and below 50% of the median wage, one-person households that earn 2 million won or less per month and households with two or more persons that earn 3 million won or less per month are categorized as financially disadvantaged. In terms of age groups, occupational characteristics (university/ graduate school students, employed workers, temporary workers, business owners, homemakers) were taken into consideration. The general income group included individuals who earn 3 million won or more per month, and 10% of the respondents in this group earned 10 million won or more per month. The gender ratio was maintained to not exceed 6:4. The survey items consisted of gender, age, home region, occupation, number of persons in the household, and income to select the respondents. The financial design importance level evaluation involved 27 IDF items according to the ID principles. The online survey was carried out from May 20th, 2021 to June 2nd, 2021 (14 days). Responses were received from a total of 305 participants. The online survey was distributed to 1,239 individuals, we received responses from 564 participants after an initial survey screening process, but a final total of 336 participants had completed the survey. From here, responses from 31 participants were excluded due to repeated answers or unsatisfactory responses arising from the completion of the survey in a short amount of time.
2.3 Survey items
Table 5 presents the 27 IDF survey items. The importance of design for each item was evaluated using a scale from 1 to 5 (1 = unimportant, 2 = sightly important, 3 = moderately important, 4 = important, 5 = very important).
|
IDF Items |
|
ID 1. Inclusivity |
|
IDF 1-1 Users should
be able to use financial services regardless of age, income/credit rating, or
financial knowledge IDF 1-2 Financial
services should be segmented to suit a wide array of customers IDF 1-3 Financial
services should be easy to understand and discover. IDF 1-4 Financial services should be designed to be
easy to access and sign-up processes should be simple. |
|
ID 2. Flexibility |
|
IDF 2-1
Various methods should be available when using financial services, such as
branches, online access, and customer service representatives IDF
2-2 Users should be able to check their financial information on various
devices (PC, mobile phones, applications, internet, kiosks) IDF 2-3 Flexible designs suitable for various financial situations
should be provided |
|
ID 3. Ease of Use |
|
IDF 3-1 Financial services should be convenient without the need
for excessive effort or help from others IDF 3-2 Financial services should be designed with methods of use
similar to general services IDF 3-3 Financial service features and financial product
information should be designed to be easily understandable |
|
ID 4. Perceptible Information |
|
IDF
4-1 Sufficient financial information should be provided, and the information
should be designed to be conveyed with transparency IDF 4-2 Reliable financial information designs should be applied IDF 4-3 Complex financial information and terminology should be easy
to learn |
|
ID 5. Safety |
|
IDF 5-1 Financial services should operate with stability IDF 5-2 Information and functions should be provided to prevent
risks related to financial assets IDF 5-3 Predictions regarding the future of financial assets
should be notified to users IDF 5-4 Information and functions should be provided to enable
users to consistently manage their own financial assets IDF 5-5 Safeguards should be put in place to protect financial
assets and personal information |
|
ID 6. Value |
|
IDF 6-1 Meaningful financial activities should be made available (donations,
sponsorships etc.) IDF 6-2 Financial investment activities should be provided to help
small companies/farmers also grow IDF 6-3 It should be possible to contribute to the improvement of
financial policies |
|
ID 7. Creativity |
|
IDF 7-1 Designs should aim to solve the problems of conventional
financial services IDF 7-2 New financial experiences should be provided through
unique services IDF 7-3 Designs should apply innovative financial technologies |
|
ID 8. Efficiency |
|
IDF 8-1 Financial features that customers need should take
priority IDF 8-2 Unnecessary features should be removed IDF 8-3 Financial features and designs should be provided with
equal quality |
3.1 Demographic characteristics of the research subjects
The demographic characteristics of the research subjects are as follows. The gender ratio of the groups was approximately 5:5 with 151 male participants (49.5%) and 154 female participants (50.5%). In terms of region, 174 participants (57%) were from the Seoul/Gyeonggi area. In terms of occupation, Group A had a relatively even distribution of students (38, 50.7%) and employed workers (37, 49.3%), whereas Group B had 43 employed workers (57.3%), 20 homemakers (26.7%), 6 temporary workers (8%), 4 in other categories (unemployed/religious, 5.3%), and 2 business owners (2.7%). Group C comprised of 26 temporary workers (32.9%), 23 homemakers (29.1%), 16 in other categories (retired/religious, 20.3%), 8 business owners (10.1%), and 6 employed workers (7.6%). Group D had 66 employed workers (86.8%), 6 temporary workers (6.6%), and 6 business owners (6.6%). In terms of monthly personal income, Group A had 45 individuals earning 2 million won or less (60%) and 30 individuals earning 2~3 million won (40%), whereas Group B had 32 individuals earning 2 million won or less (42.7%) and 43 individuals earning 2~3 million won (57.3%). Group C had 79 individuals earning 2 million won or less per month (100%). Group D had 47 individuals earning 3~5 million won per month (61.8%), 22 individuals earning 5~10 million won per month (28.9%), and seven individuals earning more than 10 million won per month (9.2%).
3.2 Comparison of the mean importance values of each group
ANOVA analysis was performed to determine significant differences between the mean importance values regarding the ID principles and IDF items of each group. The reliability was analyzed to verify the internal consistency of the mean values, and the results are shown in Table 6. As a result of Cronbach's alpha calculations, all properties produced values above 0.8, indicating that the research items were effective.
All eight ID principles were evaluated as important for the inclusiveness of financial design with mean values of 3.6 or higher. 'Safety' (ID 5) was deemed as the most important with a mean value of 4.4, whereas 'Value' (ID 6) was evaluated as the relatively least important principle with a mean value of 3.6.
|
ID pinciples |
Mean |
Std. deviation |
Cronbach's alpha |
Items |
|
ID 1 |
4.1 |
0.543 |
.865 |
4 |
|
ID 2 |
4.1 |
0.596 |
.881 |
3 |
|
ID 3 |
4.2 |
0.629 |
.874 |
3 |
|
ID 4 |
4.2 |
0.584 |
.867 |
3 |
|
ID 5 |
4.4 |
0.523 |
.868 |
5 |
|
ID 6 |
3.6 |
0.677 |
.888 |
3 |
|
ID 7 |
3.9 |
0.649 |
.877 |
3 |
|
ID 8 |
4.0 |
0.598 |
.869 |
3 |
3.2.1 Comparison of the mean ID principle values by group
According to the analysis results presented in Table 7, all items exhibited significance probabilities of .05 or higher. Indicating that there were no significant differences between the mean values of each group. Given the lack of discrepancies between the groups in terms of ID principles for inclusion in financial design, there is no need to establish separate ID principles for specific financial classes or customers. As such, it is acceptable to use the mean importance values of the ID principles for financial design.
|
ID principles |
Group A |
Group B |
Group C |
Group D |
F |
p-value |
||||
|
Mean |
SD |
Mean |
SD |
Mean |
SD |
Mean |
SD |
|||
|
ID 1 |
4.1 |
.488 |
4.1 |
.586 |
4.1 |
.539 |
4.0 |
.554 |
1.027 |
.381 |
|
ID 2 |
4.2 |
.630 |
4.2 |
.629 |
4.1 |
.530 |
4.0 |
.591 |
1.012 |
.388 |
|
ID 3 |
4.2 |
.598 |
4.3 |
.641 |
4.1 |
.606 |
4.2 |
.672 |
.892 |
.446 |
|
ID 4 |
4.2 |
.491 |
4.2 |
.625 |
4.2 |
.531 |
4.1 |
.673 |
.841 |
.472 |
|
ID 5 |
4.4 |
.425 |
4.4 |
.554 |
4.3 |
.514 |
4.3 |
.585 |
.905 |
.439 |
|
ID 6 |
3.5 |
.676 |
3.7 |
.733 |
3.6 |
.610 |
3.6 |
.689 |
.950 |
.417 |
|
ID 7 |
3.8 |
.573 |
4.0 |
.689 |
3.9 |
.582 |
3.9 |
.741 |
1.037 |
.376 |
|
ID 8 |
4.0 |
.550 |
4.1 |
.652 |
3.8 |
.549 |
4.0 |
.617 |
2.538 |
.057 |
|
SD = Standard deviation |
||||||||||
3.2.2 Comparison of the mean ID item values by group
As the mean values for the IDF items varied between the groups, the mean values were compared, as shown in Table 8. Among the 27 items, eight exhibited significant mean differences with significances probabilities of 0.05 or less. Scheffe's post-hoc analysis was conducted to investigate the importance characteristics of each group.
|
ID |
IDF |
Group A |
Group B |
Group C |
Group D |
F |
p-value |
Scheffe |
||||
|
Mean |
SD |
Mean |
SD |
Mean |
SD |
Mean |
SD |
|||||
|
ID 1 |
IDF 1-1 |
4.0 |
.805 |
4.0 |
.829 |
4.1 |
.861 |
4.0 |
.879 |
.137 |
.938 |
- |
|
IDF 1-2 |
4.1 |
.749 |
4.0 |
.726 |
4.0 |
.660 |
3.8 |
.802 |
3.062 |
.028* |
D < A, B, C |
|
|
IDF 1-3 |
4.4 |
.634 |
4.2 |
.679 |
4.2 |
.587 |
4.1 |
.645 |
2.891 |
.036* |
B, C, D < A |
|
|
IDF 1-4 |
4.1 |
.716 |
4.2 |
.727 |
4.1 |
.757 |
4.1 |
.673 |
.689 |
.559 |
- |
|
|
ID 2 |
IDF 2-1 |
4.1 |
.777 |
4.2 |
.730 |
4.3 |
.726 |
4.0 |
.763 |
2.939 |
.033* |
D < C |
|
IDF 2-2 |
4.3 |
.712 |
4.3 |
.745 |
4.2 |
.587 |
4.2 |
.719 |
.755 |
.520 |
- |
|
|
IDF 2-3 |
4.1 |
.774 |
4.2 |
.754 |
3.9 |
.696 |
4.0 |
.721 |
1.199 |
.310 |
- |
|
|
ID 3 |
IDF 3-1 |
4.4 |
.634 |
4.4 |
.678 |
4.3 |
.589 |
4.3 |
.677 |
.369 |
.775 |
- |
|
IDF 3-2 |
3.9 |
.804 |
4.0 |
.822 |
3.8 |
.807 |
4.0 |
.902 |
.968 |
.408 |
- |
|
|
IDF 3-3 |
4.3 |
.648 |
4.4 |
.629 |
4.2 |
.669 |
4.2 |
.674 |
1.367 |
.253 |
- |
|
|
ID 4 |
IDF 4-1 |
4.5 |
.622 |
4.3 |
.673 |
4.2 |
.572 |
4.2 |
.737 |
3.113 |
0.27* |
C, D < A |
|
IDF 4-2 |
3.9 |
.918 |
4.1 |
.800 |
4.1 |
.672 |
4.0 |
.825 |
1.379 |
.249 |
- |
|
|
IDF 4-3 |
4.2 |
.623 |
4.2 |
.768 |
4.2 |
.656 |
4.1 |
.744 |
.680 |
.565 |
- |
|
|
ID 5 |
IDF 5-1 |
4.5 |
.664 |
4.6 |
.617 |
4.4 |
.710 |
4.4 |
.751 |
1.221 |
.302 |
- |
|
IDF 5-2 |
4.0 |
.735 |
4.1 |
.815 |
4.0 |
.733 |
4.0 |
.800 |
.272 |
.846 |
- |
|
|
IDF 5-3 |
4.3 |
.549 |
4.3 |
.689 |
4.1 |
.640 |
4.0 |
.774 |
3.027 |
.030* |
D < A,B |
|
|
IDF 5-4 |
4.6 |
.597 |
4.5 |
.705 |
4.5 |
.616 |
4.6 |
.681 |
.205 |
.893 |
- |
|
|
IDF 5-5 |
4.7 |
.524 |
4.6 |
.678 |
4.5 |
.615 |
4.6 |
.659 |
.654 |
.581 |
- |
|
|
ID 6 |
IDF 6-1 |
3.5 |
.759 |
3.7 |
.846 |
3.7 |
.678 |
3.7 |
.793 |
1.018 |
.385 |
- |
|
IDF 6-2 |
3.2 |
.732 |
3.4 |
.899 |
3.4 |
.789 |
3.4 |
.834 |
.616 |
.605 |
- |
|
|
IDF 6-3 |
3.7 |
.841 |
4.0 |
.743 |
3.6 |
.672 |
3.7 |
.787 |
3.460 |
.017* |
A, C, D < B |
|
|
ID 7 |
IDF 7-1 |
4.1 |
.651 |
4.2 |
.746 |
4.1 |
.722 |
4.1 |
.759 |
.715 |
.544 |
- |
|
IDF 7-2 |
3.6 |
.767 |
4.0 |
.900 |
3.9 |
.679 |
3.8 |
.826 |
2.659 |
.048* |
A < B |
|
|
IDF 7-3 |
3.8 |
.863 |
3.9 |
.800 |
3.8 |
.710 |
3.7 |
.877 |
.390 |
.760 |
- |
|
|
ID 8 |
IDF 8-1 |
4.1 |
.697 |
4.2 |
.753 |
4.0 |
.649 |
4.1 |
.754 |
1.542 |
.204 |
- |
|
IDF 8-2 |
4.0 |
.657 |
4.1 |
.720 |
3.9 |
.679 |
4.0 |
.730 |
1.216 |
.304 |
- |
|
|
IDF 8-3 |
4.0 |
.753 |
3.9 |
.811 |
3.7 |
.743 |
4.0 |
.765 |
2.789 |
.041* |
C < A, B, D |
|
|
*p < .05, SD = Standard deviation |
||||||||||||
Eight items resulted in mean differences between the groups. In the case of 'Inclusivity' (ID 1), two items produced mean differences: Group D placed less importance on 'Service Segmentation' (IDF 1-2) compared to Groups A, B, and C, and Group A placed greater importance on 'Ease of Discovery' (IDF 1-3) compared to Groups B, C, and D. Under 'Flexibility' (ID 2), 'Offering Various Methods of Use' (IDF 2-1) was considered as more important by Group C compared to Group D, and in the case of 'Perceptible In-formation' (ID 4), 'Transparent Information' (IDF 4-1) was viewed as more important by Group A compared to Groups C and D. On the other hand, less importance was placed on 'Asset Forecasting' (IDF 5-3) under 'Safety' (ID 5) by Group D compared to Groups A and B. In the case of 'Value' (ID 6), 'Participation in Financial Policy Reforms' (IDF 6-3) was viewed as more important by those in Group B compared to Groups A, C, and D, whereas under 'Creativity' (ID7), 'New Financial Experiences' (IDF 7-2) was considered as more important by those in Group B compared to those in Group A. Lastly, 'Design Quality Management' (IDF 8-3) under 'Efficiency' (ID 8) was evaluated as less important by Group C compared to Groups A, B, and D.
The differences between the groups are as follows. The three items in which Group A deviated from the others were 'Ease of Discovery' (IDF 1-3) and 'Transparent Information' (IDF 4-1), which Group A evaluated with greater importance, and 'New Financial Experiences' (IDF 7-2), which was evaluated as less important. Group B showed differences in two items with greater importance being placed on 'Participation in Financial Policy Reforms' (IDF 6-3) and 'New Financial Experiences' (IDF 7-2). Group C produced differences in two items with 'Various Methods of Use' (IDF 2-1) considered important and 'Design Quality Management' considered as less important. Lastly, Group D deviated from the other groups in three items with no items evaluated as more important and 'Service Segmentation' (IDF 1-2), 'Various Methods of Use' (IDF 1-2), and 'Asset Forecasting' (IDF 5-3) evaluated with less importance.
3.3 IDF factor analysis of the ID principles based on IDF by group
3.3.1 Factor analysis using the principal component method
A factor analysis was conducted using the principal component analysis results of the evaluated ID principles. The analysis results are presented in Table 9. The KMO measure was 0.899, and the χ2 result of Bartlett's test had a significance probability of less than 0.001, which is suitable for the factor analysis model. The order of the ID principles with the highest factor values is as follows: 'Inclusivity' (ID 1), 'Safety' (ID 5), 'Perceptible Information' (ID 4), 'Efficiency' (ID 8), 'Ease of Use' (ID 3), 'Creativity' (ID 7), 'Flexibility' (ID 2), and 'Value' (ID 6).
|
Observed variables |
Factor |
|
ID 1. Inclusivity |
.831 |
|
ID 5. Safety |
.813 |
|
ID 4. Perceptible Information |
.806 |
|
ID 8. Efficiency |
.785 |
|
ID 3. Ease of Use |
.765 |
|
ID 7. Creativity |
.715 |
|
ID 2. Flexibility |
.686 |
|
ID 6. Value |
.628 |
|
Cumulative Variance = 57.3%, KMO = .899, Bartlett test χ2 = 1217.507, p <
0.001 |
|
3.3.2 Factor analysis by group
Factor analysis was performed to investigate which ID principles based on IDF were perceived as similar concepts. The factors were extracted by performing principal axis factoring and varimax rotation. According to the results shown in Table 10, the eight ID principles were perceived as four concepts. In all five cases, the cumulative variance was above 60%, and the χ2 result of Bartlett's test had a significance probability of less than 0.001.
When observing the grouped principles as a whole, the ID principles derived from the CSV concept - 'Creativity' (ID 7), 'Value' (ID 6), and 'Efficiency' (ID 8) - were perceived as a common concept. The second concept involved principles related to the accessibility and usability to better include a wide variety of users: 'Ease of Use' (ID 3) and 'Inclusivity' (ID 1). 'Flexibility' (ID 2) was recognized as a concept involving flexible design that enables various situations and services. Lastly, 'Safety' (ID 5) and 'Perceptible Information' (ID 4) were included in the concept involving financial education and security for financial inclusion.
The differences in the results between the groups are as follows. Group A grouped the principles under four concepts: 'Ease of Use' (ID 3), 'Flexibility' (ID 2), and 'Inclusivity' (ID 1) as the first common concept, 'Perceptible Information' (ID 4) and 'Safety' (ID 5) as the second concept, 'Value' (ID 6) as the third concept, and 'Efficiency' (ID 8) and 'Creativity' (ID 7) as the fourth concept. Compared to the overall results, 'Flexibility' (ID 2) was perceived to be a common concept with ID 3 and ID 1, whereas 'Value' (ID 6) was separated from ID 8 and ID 7.
|
Total |
Group A |
Group B |
Group C |
Group D |
||||||||||
|
ID |
Factor loading |
ID |
Factor loading |
ID |
Factor loading |
ID |
Factor loading |
ID |
Factor loading |
|||||
|
ID
7 |
1 |
.684 |
ID
3 |
1 |
.791 |
ID
7 |
1 |
.822 |
ID 2 |
1 |
.644 |
ID 3 |
1 |
.779 |
|
ID
6 |
1 |
.657 |
ID
2 |
1 |
.643 |
ID
8 |
1 |
.684 |
ID 7 |
1 |
.562 |
ID 1 |
1 |
.752 |
|
ID
8 |
1 |
.514 |
ID
1 |
1 |
.640 |
ID
6 |
1 |
.585 |
ID 8 |
1 |
.520 |
ID 8 |
1 |
.722 |
|
ID 3 |
2 |
.793 |
ID 4 |
2 |
.709 |
ID 3 |
2 |
.864 |
ID 3 |
2 |
.729 |
ID 2 |
1 |
.576 |
|
ID 1 |
2 |
.595 |
ID 5 |
2 |
.591 |
ID 1 |
2 |
.646 |
ID 1 |
2 |
.662 |
ID 7 |
2 |
.782 |
|
ID
2 |
3 |
.613 |
ID
6 |
3 |
.791 |
ID 5 |
2 |
.556 |
ID 4 |
3 |
.677 |
ID 4 |
2 |
.614 |
|
ID 5 |
4 |
.578 |
ID 8 |
4 |
.499 |
ID
2 |
3 |
.757 |
ID 5 |
3 |
.648 |
ID 6 |
3 |
.677 |
|
ID 4 |
4 |
.578 |
ID 7 |
4 |
.488 |
ID 4 |
4 |
.701 |
ID 6 |
4 |
.552 |
ID 5 |
4 |
.677 |
|
Cumulative Variance KMO = 0.899, Bartlett test χ2 =
1217.507, |
Cumulative Variance KMO = 0.823, Bartlett test χ2 =
195.180, |
Cumulative Variance KMO = 0.888, Bartlett test χ2 =
374.056, |
Cumulative Variance KMO = 0.868, Bartlett test χ2 =
320.442, |
Cumulative Variance KMO = 0.863, Bartlett test χ2 =
371.492, |
||||||||||
In the case of Group B, the first concept group included 'Creativity' (ID 7), 'Efficiency' (ID 8), and 'Value' (ID 6), the second concept group included 'Ease of Use' (ID 3), 'Inclusivity' (ID 1), and 'Safety' (ID 5), the third concept included 'Flexibility' (ID 2), and the fourth concept included 'Perceptible Information' (ID 4). Compared to the overall results, 'Safety' (ID 5) was perceived to be a common concept with ID 3 and ID 1.
In the case of Group C, the first concept group included 'Flexibility' (ID 2), 'Creativity' (ID 7), and 'Efficiency' (ID 8), the second concept group included 'Ease of Use' (ID 3) and 'Inclusivity' (ID 1), the third concept group included 'Perceptible Information' (ID 4) and 'Safety' (ID 5), and the fourth concept included 'Value' (ID 6). Compared to the overall results, 'Flexibility' (ID 2) was grouped with ID 7 and ID 8, whereas 'Value' (ID 6) was separated from ID 7 and ID 8.
In the case of Group D, the first concept group included 'Ease of Use' (ID 3), 'Inclusivity' (ID 1), 'Efficiency' (ID 8), and 'Flexibility' (ID 2), the second concept group included 'Creativity' (ID 7) and 'Per-ceptible Information' (ID 4), the third concept group included 'Value' (ID 6), and the fourth concept group included 'Safety' (ID 5). Compared to the overall results, 'Efficiency' (ID 8) and 'Flexibility' (ID 2) were grouped with ID 3 and ID 1, 'Creativity' (ID 7) was grouped with ID 4, and 'Safety' (ID 5) was separated from ID 4.
This study implemented ID to investigate how the importance and perception of design differs for those who are financially disadvantaged. Among the eight ID principles defined in this study, 'Safety' was considered as the most important, whereas 'Value' was associated with the least importance. Furthermore, there was no discrepancy between the groups in terms of the importance of the ID principles, indicating that the principles were applicable to all types of users for the purpose of improving inclusion in financial design.
On the other hand, the groups produced varied results for eight IDF items. The group with low-income individuals in the 20~29 age range placed greater importance on the 'Ease of Discovery' and 'Transparent Information' of financial services, whereas less importance was placed on 'New Financial Experiences'. Low-income individuals in the 30~59 age range considered 'Participation in Financial Policy Reforms' and 'New Financial Experiences' as important items. Low-income individuals aged 60 years and above viewed 'Offers Various Methods of Use' as important in contrast to 'Design Quality Management', which was considered as less important. Lastly, individuals in the 30~59 age range with general income levels placed greater importance on 'Service Segmentation', 'Offers Various Methods of Use', and 'Asset Forecasting' compared to the other groups. From the investigation, one can better understand how financial designs can be differentiated and how design priorities can be defined in detail according to user characteristics.
There were also differences between the groups in terms of how each group perceived the ID principles as common concepts. All groups assembled the eight ID principles into four concepts. Notably, all groups associated 'Inclusivity' with 'Ease of Use'. The inclusion of various types of users was also grouped as a common concept with the accessibility and usability of financial services. In the case of the three low-income groups, 'Perceptible Information' and 'Safety' were grouped as a single concept and 'Creativity' and 'Efficiency' were grouped into another concept. On the other hand, the general-income group of the 30~59 age range deviated from the low-income groups by grouping 'Perceptible Information' and 'Creativity' as a single concept and 'Efficiency', 'Inclusivity', 'Ease of Use', and 'Flexibility' as another common concept. By understanding such variations in perspective, one can contribute to the development of design directions and strategies that consider the characteristics of users for financial inclusion.
The limitations of this study are as follows. First, the financially disadvantaged groups did not include small rural households, foreigners, and persons with disabilities, which are all included in the definition of financial inclusion. Furthermore, as the study only included participants who could respond through an online survey, the study was not able to include individuals who had limited access to digital services. Future studies should include user bases comprised of a wider variety of participants to consider a more diverse set of factors.
The second limitation involves the lacking variety in the participants' occupations. As most participants were students, homemakers, or employed workers, the findings of this study could be viewed as reflecting the opinions of those with similar occupations regarding the importance of financial design. Further financial design research is necessary to consider the financial situations of temporary workers and small business owners with greater depth.
Lastly, this study is limited in that the evaluation of importance is based on the subjective judgement of the respondents. The bias of the respondents in the survey results was not fully resolved, and there is insufficient context regarding the specific financial circumstances of the respondents or their history and needs regarding the use of financial services. Further research is required with such information.
In this study, ID principles were redefined by combining the existing principles of UD with the economic values derived from CSV to consider practical ID principles that are vital in implementing the principles of 'inclusion' in the financial sector. The findings of this study are expected to be used to further develop user-centered financial design that embraces both the financially disadvantaged as well as those with general income levels. The authors also look forward to seeing the findings of this study be used to help realize financial inclusion by incorporating the economic values of the financial industry. All in all, this research highlights the importance of minimizing discrimination, ensuring access to financial services, and protecting financial assets to benefit the economic activities of all members of society.
References
1. An, S., Kim, H., Shin, K. and Jang, H., Impacts of Financial Innovations in an Open Economy and Implications of Blockchain Technology, KIEP (Korea Institute for International Economic Policy) Research Paper Policy Analyses, 18-21, 2018.
Google Scholar
2. Authority, F.C., "Understanding the financial lives of UK adults: Findings from the FCA's Financial Lives Survey 2017", London: FCA, 2017.
3. Bateman, M., "Let's not kid ourselves that financial inclusion will help the poor", The Guardian, 2012.
4. Byeon, H.W., Trends and Implications for Overseas Financial Inclusion, KIRI (Korea Insurance Research Institute) Report (FOCUS), 469, 10-18, 2019. https://kiss.kstudy.com/thesis/thesis-view.asp?key=3683413 (retrieved 10 June 2021).
5. Clarkson, P.J. and Coleman, R., History of Inclusive Design in the UK, Applied Ergonomics, 46, 235-247, 2015.
Google Scholar
6. Coleman, R., The Case for inclusive design-an overview. In: Proceedings of the 12th Triennial Congress, International Ergonomics Association and the Human Factors Association, Canada 1994.
7. Demirguc-Kunt, A., Klapper, L.F. and Singer, D., Financial Inclusion and legal discrimination against women: evidence from developing countries, World Bank Policy Research Working Paper, 6416, 2013.
Google Scholar
8. Demirguc-Kunt, A., Klapper, L., Singer, D., Ansar, S. and Hess, J., "The Global Findex Database 2017: Measuring financial inclusion and the fintech revolution", World Bank Group, 2017.
Google Scholar
9. Design Council, The principles of inclusive design, Retrieved, 23, 14, 2014.
10. Earnin, https://www.earnin.com/ (retrieved 17 June, 2021).
11. Edward, S. and Jordana, L.M., Design: Inclusive Environments, 2012.
12. EthicHub, https://www.ethichub.com/en/ (retrieved 12 June, 2021).
13. GPFI Global Partnership for Financial Inclusion, https://www.gpfi.org/publications/g20-principles-innovative-financial-inclusion-executive-brief (retrieved 12 June, 2021).
14. Inclusive Design Research Center, OCAD University, https://idrc.ocadu.ca (retrieved 17 June, 2021)
15. Kilara, T. and Rhyne, E., Customer-centricity for financial inclusion, 2014.
Google Scholar
16. Kim, T.S., Characteristics of Inclusive Design and Its Meaning in the Future Society, Archives of Design Research, 28.2, 137-151, 2015.
Google Scholar
17. Kramer, M.R. and Pfitzer, M.W., "The ecosystem of shared value", Harvard Business Review, 94.10, 80-89, 2016.
Google Scholar
18. Money Smart Program, https://www.fdic.gov/resources/consumers/money-smart/index.html (retrieved 17 June, 2021).
19. M-Pesa, https://www.vodafone.com/about-vodafone/what-we-do/consumer-products-and-services/m-pesa (retrieved 16 June, 2021).
20. Oh, S.H., Yim, H.N. and Lee, K.S., Study of Inclusive Financial Strategies Measures, KOICA (Korea International Cooperation Agency) Research Report, 1-94, 2017. https://www.dbpia.co.kr/journal/articleDetail?nodeId=NODE07365536 (retrieved 12 June, 2021).
21. Porter, M.E. and Kramer, M.R., "The Big Idea: Creating Shared Value", Harvard Business Review, 89(1-2), 1-12, 2011.
22. Reach52, https://reach52.com/ (retrieved 15 June, 2021).
23. Revolut, https://www.revolut.com/ (retrieved 17 June, 2021).
24. Shin, C.G., "CSR and CSV (Creating Shared Value)", KCGS (Korea Corporate Governance Service) Corporate Governance Review, 66, 57-66, 2013.
25. Shin, K.H., Digital alienation of financial consumers and response of each country, KMCI (Korea Capital market institute), 2021, Capital Market Focus 2021-07, http://www.kcmi.re.kr/publications/pub_detail_view?syear=2021&zcd=002001016&zno=1588& cno=5669 (retrieved 12 June, 2021).
26. The Principles of universal design, NCSU, 1997, https://projects.ncsu.edu/ncsu/design/cud/ (retrieved 17 June 2021).
27. The Report on the Digital Divide. MSIT (Ministry of Science and ICT, Korea), NIA (National Infornation Society Agency, Korea). Available online: 2020, https://www.nia.or.kr/site/nia_kor/ex/bbs/List.do?cbIdx=81623 (accessed on 17 June 2021).
PIDS App ServiceClick here!