eISSN: 2093-8462 http://jesk.or.kr
Open Access, Peer-reviewed
eISSN: 2093-8462 http://jesk.or.kr
Open Access, Peer-reviewed
Kwang Tae Jung
10.5143/JESK.2017.36.4.343 Epub 2017 August 30
Abstract
Objective: This study aims to evaluate the efficiency of two representative subway map design types, namely a diagram type and a geographical type using physiological metrics, performance metrics, and self-reported metrics, which are representative usability metrics.
Background: Subway maps need to be designed in order for users to quickly search and recognize subway line information. Although most cities' subway maps currently use the diagram type designed by Henry Beck, New York City's subway map has recently been changed to the subway map type combined with the geographical type designed by Michael Hertz. However, not many studies on its efficiency are found, and the studies that are available mainly depend on questionnaire surveys or take on a subjective behavioral study type based on experts' experiences. In this regard, evaluation through a more objective method is needed.
Method: This study employed usability metrics as a method to evaluate the efficiency of information search targeting the diagram type and geographical type subway maps used mostly as subway maps. To this end, physiological metrics obtained through eye tracking, task completion time, representative metric of task performance, and subjective evaluation metrics were used for the suitability evaluation of subway map designs.
Results: In the result of gaze movement distance analysis, no significant difference was shown in the two design types in terms of a process finding a departure station from the starting point and a process finding a transfer station between the departure station and arrival station (destination). However, the gaze movement distance in the process finding the arrival station at the departure station was significantly shorter in the geographical type, rather than in the diagram type. The analysis of task completion time showed a result similar to the gaze movement distance analysis result. Task completion time was significantly shorter in the geographical type, rather than in the diagram type, which is in the process finding the arrival station at the departure station. In other information search processes, no significant difference was shown. As a result of subjective evaluation metrics analysis, no significant difference was revealed in the two design types.
Conclusion: An analysis on the two representative subway map design types was carried out via the adoption of usability metrics. As a result, although no significant difference was shown in some information search processes, it was revealed that information search was easier in the geographical type overall. Also, it was found that usability metrics can be effectively used to evaluate the design types of subway maps.
Application: The study results can be used to set design direction to offer ease in information search on subway lines. The study also can be used as a method to evaluate a subway map's design type.
Keywords
Subway map Eye tracking Usability metrics
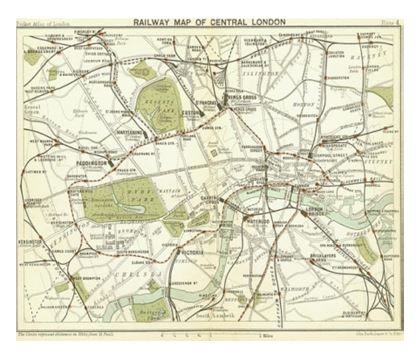
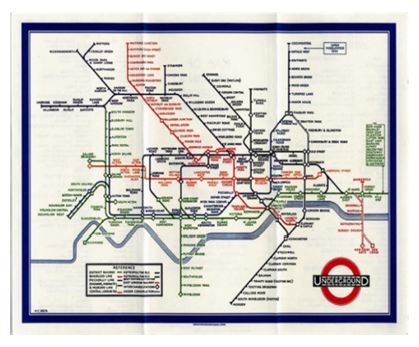
The history of a subway map began alongside the history of the London subway. Upon looking at the map of the London subway operated for the first time in 1863 (Figure 1), one can see that the map expressed topographic information and winding lines in 1899, dubbed as the early period of subway operation (Morrison, 1996). As subway maps became simplified, subway maps were designed similar to the current subway maps by Henry Beck in 1933 (Morrison, 1996) as shown in Figure 2. Henry Beck designed a subway map in a mode emphasizing the functionality of comfort when looking at the map, rather than geographical distance. Such a subway map has adopted a new concept that simplifies the information graphically delivering type and greatly contributing to graphic design development thereby (Jin, 2003). Since then, subway maps have gradually been improved by applying different types of layout strategy, color code, or symbolic expression, as well as additional information like labels (Burch et al., 2014).
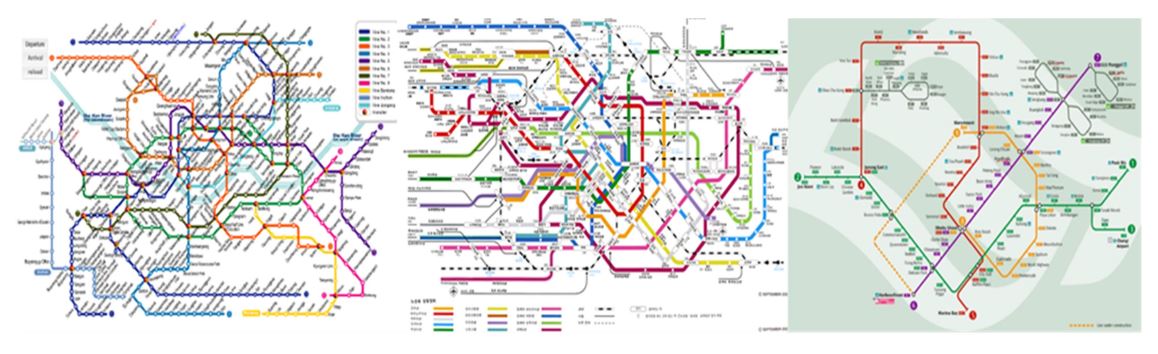
The subway map type commonly used nowadays is the diagram type subway map designed by Henry Beck as shown in Figure 3. It is designed for users to precisely find the general stations' order and the transfer stations' location by arranging existing winding lines with diagonal lines, vertical lines, and horizontal lines (Wolff, 2007). Such a type of subway map design is used in many cities worldwide including Korea's Seoul Metropolitan Area, London, Paris, Tokyo, Moscow, and Frankfurt (Oh, 2004).
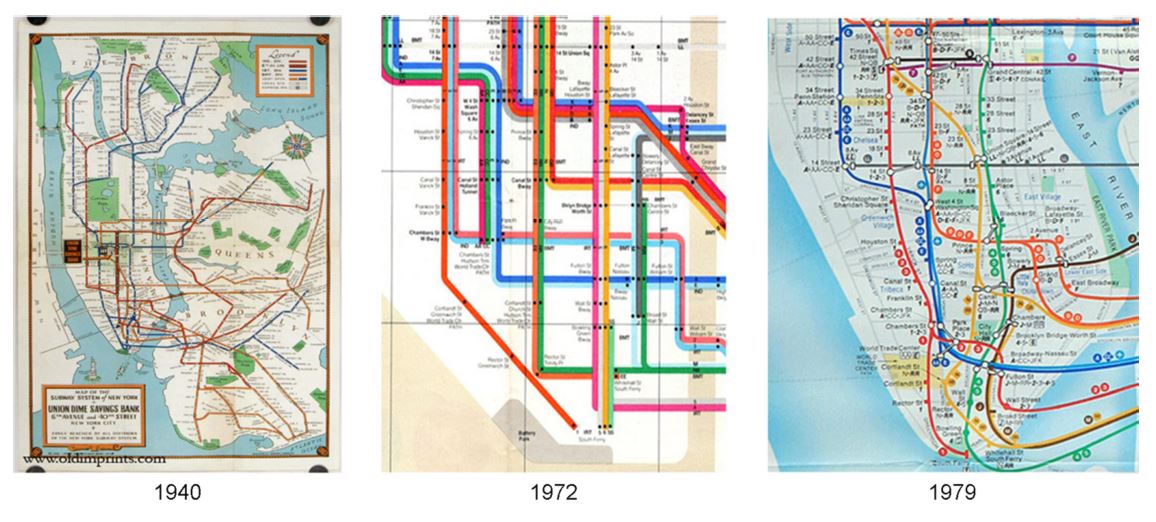
However, the subway map of the New York city which opened in 1904 shows the changes in designing subway maps. As shown in Figure 4, the subway map designed through Massimo Vignelli in 1972 was created based on the Henri Beck's London subway map; however, there were many controversies in its functional aspect, and thus it was designed again by Michael Hertz in 1979, and it became what the subway map is today (Bain, 2010). Although most subway maps use a diagram type containing simple and required-only information, this design uses a geographical style utilizing curves. There has been a question on why New York's subway map was designed in a geographical type again, but there has been no study on which type is more effective.
Regardless of design type, a subway map is expressed with a schematic method, one of the non-language communication methods, so that information can be delivered more precisely and quickly to people through language and letters. It is important how clearly information can be delivered through the design elements consisting of dots, lines, and colors (Jung and Jang, 2001) and it is necessary to design subway maps through which people unfamiliar with a city's geography can easily find the subway lines (Burch et al., 2014). All people should be able to use and easily, precisely, and quickly recognize the information presented in a subway map, regardless of gender, age, nationality, and social status (Oh, 2004).
Burch et al. (2014) raised the need to study users' gaze movement patterns on a subway map, because it is not clear how users' gaze is indicated in a task of searching subway lines, although many attempts to improve the arrangement, color codes, and symbolic expressions of subway maps, as well as information for travelers, have been carried out. The said team has conducted a study to identify gaze movement patterns in the subway line search process. However, the previous studies on subway maps were mainly dependent upon questionnaire surveys or based on subjective type research using experts' experiences (Oh, 2004; Netzel et al., 2016). Thus, a method evaluating a subway map's efficiency is necessary based on experimental data.
Tullis and Alvert (2008) classified the methods to evaluate system usability in the interaction process between users and system into the methods using performance metrics, issue-based metrics, self-reported metrics, and behavioral and physiological metrics. This study comparatively evaluated the information search efficiency of two representative subway map types—a diagram type and a geographical type—by using performance metrics, self-reported metrics, and behavioral and physiological metrics, which all can be used as comparative evaluation metrics among the system's usability metrics on two subjects.
2.1 Method
This study aimed to identify which subway map design is more efficient upon targeting two representative subway maps in order to evaluate a subway map's suitability by utilizing usability metrics. Towards this end, it is necessary to measure gaze path and movement distance by analyzing time spent for information search and gaze path targeting each subway map through a quantitative analysis (Park, 2016). After the experiment, subjective satisfaction evaluation is needed.
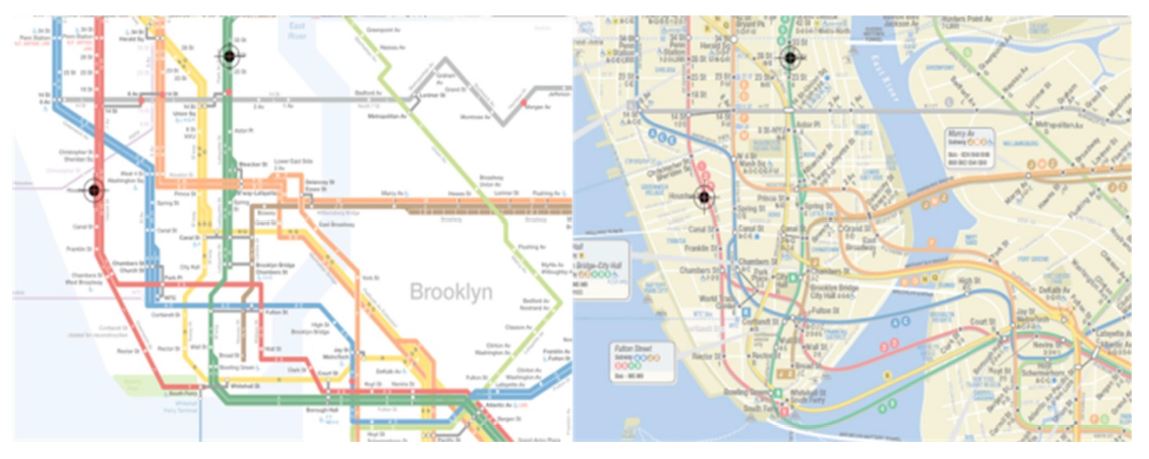
As experimental data for the study, foreign subway maps were selected, instead of domestic subway map, so as to interrupt the subjects' prior knowledge on the subway line information. The subway maps selected for the experiment was New York's subway maps: the simple diagram type subway map (A) in 2008 and the geographical type subway map using curves in 2010. As a result of a preliminary experiment, there was a problem of legibility due to too many lines and too much information; therefore, part of the whole lines including Manhattan was used as experimental data (Figure 5).
2.2 Subjects
The subjects participating in the experiment were 16 university students (8 males and 8 females). The male students' mean age was 23.6 years and the female students' mean age was 21.9 years. The subjects had no problem in eyesight, had no prior knowledge on New York's subway maps, and could read English.
The subjects were divided into two groups to rule out learning on the subway line information. Each group consisted of four male students and four female students who were selected randomly. One group participated in the experiment targeting the diagram type while the other group participated in the experiment targeting the geographical type.
2.3 Task
Each group participated in the experiment after sufficiently listening to the explanation on the characteristics of the New York subway map and transfer stations prior to the experiment. The subjects were directed to carry out a task to find a departure station, an arrival station (destination), and a transfer station commencing on the starting point on the subway map displayed on the monitor 50 cm away from them. The task can be divided as follows:
Task 1. Pointing by beginning at the starting point and finding the departure station (Houston St.).
Task 2. Pointing by finding the arrival station (23rd St.) beginning at the departure station (Houston St.).
Task 3. Pointing by finding the transfer station between the departure station and the arrival station.
2.4 Equipment
An eye tracker (Dikablis System) was used to track the user's gaze (Figure 6).
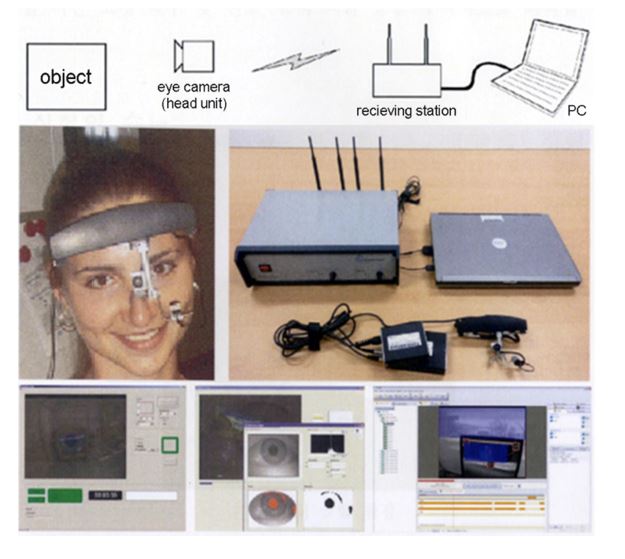
In addition, a stop watch to measure task completion time, a desktop computer, and a 19-inch monitor with a minimum resolution of 1280*1024 and that can identify objects without zoom out were used.
By using the software D-Lab to analyze the data measured by the eye tracker, the information on the fixation points and saccade of the subjects was drawn (Kim et al., 2013). Through these, a gaze path analysis was conducted, and gaze movement distance was calculated.
3.1 Gaze movement analysis
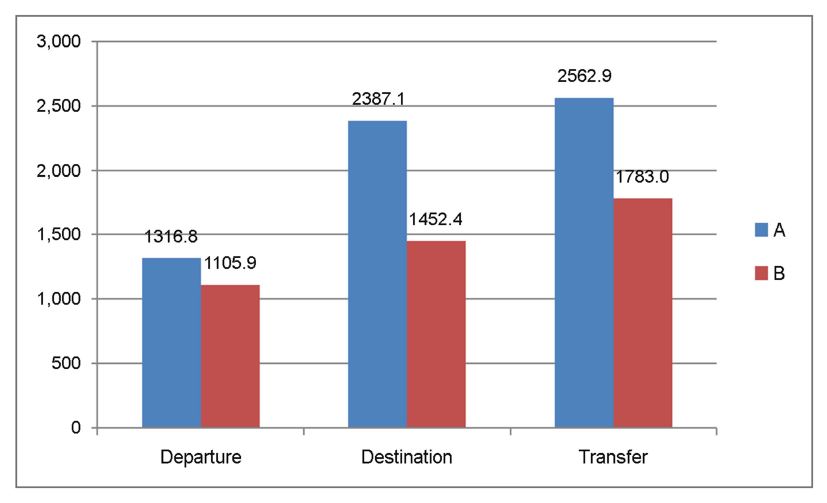
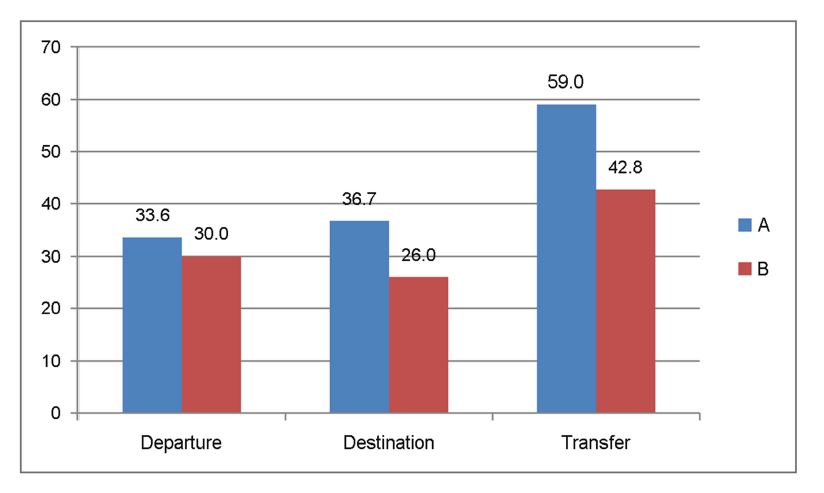
In the process of searching information on the subway map, gaze movement can be effectively used to evaluate the efficiency of information search. Generally, information search is more efficient, as gaze movement is smaller (Sless, 2008). This study carried out a gaze movement analysis on finding a departure station beginning at the starting point, finding an arrival station starting at the departure station, and finding a transfer station between the departure station and the arrival station. Gaze movement distance was calculated by analyzing the eye tracking result on each task. Table 1 shows the analysis of variance (ANOVA) result to find out whether significant differences exist in gaze movement distance between the subway map types A and B on the tree tasks. Upon looking at the table, no significant difference was found at the significance level of 0.05 in relation with finding the departure station at the starting point (p=0.351>0.05); however, gaze movement distance on the geographical type subway map was slightly smaller in Figure 7, showing the mean gaze movement distance. Significant differences were found between the type A and type B subway maps on the gaze movement distance from the departure station to the arrival station (p =0.049<0.05). In Figure 7, the mean gaze movement distance of the geographical type subway map was much shorter. Although no significant difference was found at the significance level of 0.05 in finding the transfer station between the departure and arrival stations (p =0.081>0.05), the gaze movement distance on the type B was shorter as shown in Figure 7.
|
|
Sum of squares |
df |
Mean square |
F |
Sig. |
|
|
Departure |
Between groups |
177873.063 |
1 |
177873.063 |
.931 |
.351 |
|
Within groups |
2674168.375 |
14 |
191012.027 |
|
|
|
|
Total |
2852041.438 |
15 |
|
|
|
|
|
Destination |
Between groups |
3495030.250 |
1 |
3495030.250 |
4.663 |
.049 |
|
Within groups |
1.049E7 |
14 |
749552.625 |
|
|
|
|
Total |
1.399E7 |
15 |
|
|
|
|
|
Transfer |
Between groups |
2432820.063 |
1 |
2432820.063 |
3.529 |
.081 |
|
Within groups |
9651394.875 |
14 |
689385.348 |
|
|
|
|
Total |
1.208E7 |
15 |
|
|
|
|
In the analysis results above, the gaze movement distance to search information in the type B subway map (geographical type) was shorter, based on the gaze movement distance in the information search process in the subway map types A and B. Therefore, type B can be more efficient than type A.
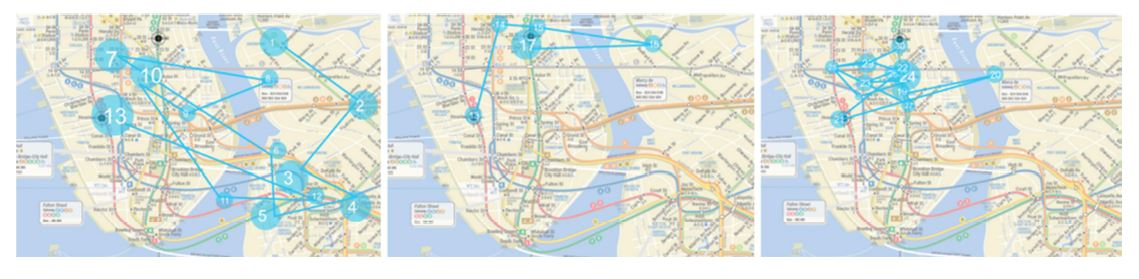
Figure 8 shows one subject's gaze path on the type A subway map. The subject looked at the surrounding of the transfer station when the subject was finding the departure station at the starting point, and the gaze movement range was quite large on the screen. Also, the gaze movement range was large in the finding process at the arrival station, after the departure station was found. In the process of finding the transfer station, the subject's eye was searching the surrounding of the station, not properly finding the transfer station linking the departure and arrival stations. However, the gaze moved a short distance around the departure and arrival stations for search.
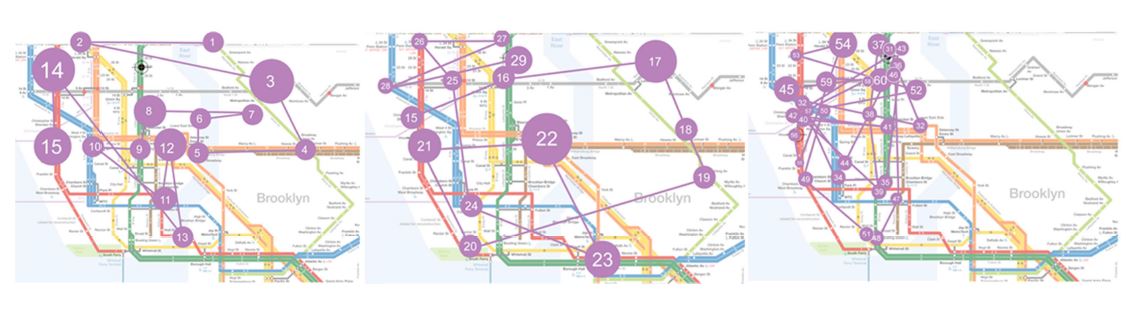
Figure 9 shows the gaze path of one subject on the type B subway map. In the process of finding the departure station at the starting point on the type B subway map, the subject showed a tendency of gaze movement browsing through the entire screen, but small gaze movement was conducted in the process of finding the arrival station after finding the departure station. The process of finding the transfer station between the departure station and the arrival station was conducted without considerable difficulties.
3.2 Analysis of task completion time
Through the time spent to complete tasks, efficiency on the information search of types A and B was analyzed. Table 2 shows the ANOVA result on the two groups' time spent to search information on the type A and B subway maps, respectively, while Figure 10 reveals the graph showing the mean task completion time.
According to the result, although no significant difference was found at the significance level of 0.05 in the task completion time of type A and type B in the process of finding the departure station at the starting point (p =0.377>0.05), the task completion time was a bit shorter in type B. Meanwhile, a significant difference was found at the significance level of 0.05 regarding the task completion time between the type A and type B in the process of finding the arrival station at the departure station (p =0.036 <0.05), whereas the task completion time was much shorter on type B. Although no significant difference existed at the significance level of 0.05 in the task completion time of type A and type B in relation with the maps on the process to find the transfer station between the departure and arrival stations (p =0.066>0.05), the task completion time on type B was shorter.
In the analysis results above, time spent to find information on the type B subway map expressed with geographical style was shorter, and thus type B is more efficient than type A, based on the information search completion time on types A and B.
|
|
Sum of squares |
df |
Mean square |
F |
Sig. |
|
|
Departure |
Between groups |
52.381 |
1 |
52.381 |
.831 |
.377 |
|
Within groups |
882.152 |
14 |
63.011 |
|
|
|
|
Total |
934.533 |
15 |
|
|
|
|
|
Destination |
Between groups |
455.609 |
1 |
455.609 |
5.403 |
.036 |
|
Within groups |
1180.468 |
14 |
84.319 |
|
|
|
|
Total |
1636.077 |
15 |
|
|
|
|
|
Transfer |
Between groups |
1053.976 |
1 |
1053.976 |
3.981 |
.066 |
|
Within groups |
3706.741 |
14 |
264.767 |
|
|
|
|
Total |
4760.718 |
15 |
|
|
|
|
3.3 Search efficiency
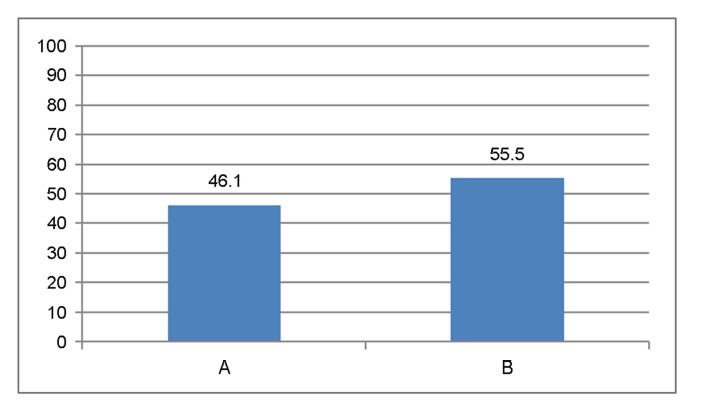
Table 3 and Figure 11 show the ANOVA table on the subjectively evaluated result concerned with the information search on the subway map types A and B and mean value graph, respectively. According to the results, no significant difference was shown at the significance level of 0.05 in terms of information search efficiency on the types A and B subway maps (p =0.062>0.05); however, mean satisfaction was higher on the type B subway map.
|
|
Sum of squares |
df |
Mean square |
F |
Sig. |
|
Between groups |
351.563 |
1 |
351.563 |
4.105 |
.062 |
|
Within groups |
1198.875 |
14 |
85.634 |
|
|
|
Total |
1550.438 |
15 |
|
|
|
This study comparatively evaluated a design's suitability based on gaze movement distance, information search time, and subjective satisfaction evaluation of information search, which are quantitative usability metrics, targeting the two design types of subway maps, namely diagram type and geographical type. According to the result, the geographical type was more suitable than the diagram type in searching information. Although the design of the diagram type was simple overall, one's gaze stayed longer since the characters were small, and the time to recognize the required information seemed to take longer. Even though geographical type design seemed to be slightly complex overall, it had a positive effect on subway line search information in the sense that a user understood geographical information to some degree; therefore, more effective result was shown by the geographical type design. Such a result could be confirmed through the interview with the subjects after the experiment. The result is different from the prediction that the diagram type subway map would be easier and simpler.
The generalization of the result of this study, however, can be insufficient. The experiment was carried out for the limited tasks targeting New York City’s subway maps, and thus an experiment needs to be conducted under more diverse conditions for generalization. Even though the cause of long gaze focus at a specific point was to be figured out through eye tracking, there were difficulties in the identification of accurate design factors (station name, line name, and line color) because the distance of each graphic factor was too close.
This study, however, is meaningful in that objective data were drawn through an experimental method, such as eye tracking, and the study was carried out based on the result, whereas existing studies on subway maps were dependent upon questionnaire surveys or experts' experiences. There is a need to conduct a further study on evaluating the efficiency of diagram and geographical types of subway maps in the state that subjects have prior information like in the case of a domestic subway map.
References
1. Bain, P., Aspects of Transit Map Design, Parsons Journal of Information Mapping, 2(3), 1-6, 2010.
Crossref
2. Jin, M., Design Elements & Guidelines of Route Maps for Underground Railways, Journal of the Korean Society for Railway, 6(2), 67-73, 2003.
Crossref
Google Scholar
3. Jung, Y. and Jang, H., Research on the components of line maps in Inforgraphic - related to the line map of subways in Seoul, Bulletin of Korean Society of Basic Design & Art, 2(2), 141-151, 2001.
Crossref
4. Burch, M., Kurzhals, K. and Weiskopf, D., Visual Task Solution Strategies in Public Transport Maps, ET4S, 32-36, 2014.
Crossref
Google Scholar
5. Kim, H., Jung, K. and Lee, D., A study on the menu type of instrument cluster IVIS, Journal of the Ergonomics Society of Korea, 32(2), 189-198, 2013.
Crossref
Google Scholar
6. Morrison, A., Public Transport Maps in Western European Cities, Cartographic Journal, 33(2), 93-110, 1996.
Crossref
Google Scholar
7. Oh, S., A study on the improvement of Seoul subway map in terms of information graphics, Master Thesis, Hongik University, 2004.
Crossref
8. Netzel, R., Ohlhausen, B., Kurzhals, K., Woods, R., Burch, M. and Weiskopf, D., User performance and reading strategies for metro maps: An eye tracking study, Special Issue on Eye tracking for Spatial Research in Spatial Cognition and Computation, 39-64, 2016.
Crossref
Google Scholar
9. Park, H., A review on the application of eye-tracking in design areas, Journal of the Ergonomics Society of Korea, 35(5), 391-401, 2016.
Crossref
Google Scholar
10. Sless, D., Measuring Information Design, Information Design Journal, 16(3), 250-258, 2008.
Crossref
Google Scholar
11. Tullis, T. and Alvert, B., Measuring the User Experience, Elsevier, 2008.
Crossref
12. Wolff, A., Drawing subway maps: A survery, Informatik, 22, 23-44, 2007.
Crossref
Google Scholar
PIDS App ServiceClick here!