eISSN: 2093-8462 http://jesk.or.kr
Open Access, Peer-reviewed
eISSN: 2093-8462 http://jesk.or.kr
Open Access, Peer-reviewed
Amir Tjolleng
, Kihyo Jung
10.5143/JESK.2022.41.1.15 Epub 2022 March 01
Abstract
Objective: This study developed an artificial neural network (ANN) model that can detect an early sign of drowsy driving (fighting-off drowsiness) based on electrocardiography (ECG) signals.
Background: Detecting an early state of drowsy driving is very important to prevent vehicle accidents on the road by providing appropriate interventions to the driver.
Method: The ECG signals for forty-three participants (mean age: 23.1, SD: 1.6) were recorded while performing a simulator-based monotonous driving for 20 minutes, and the ECG for twenty participants (mean age: 23.2, SD: 1.3) who suffered drowsiness were used in further analysis. The three driver states (normal, fighting-off drowsiness, and drowsy) were determined through participant's subjective report and video recording analysis. Six ECG measures in time and frequency domains were derived from the ECG and pre-processed to compensate individual variations in heart response.
Results: The model was trained using a feedforward network with a scaled conjugate gradient, and its average accuracy was over 99% for the training and testing data.
Conclusion: This study showed that the ECG can be used as a biometric indicator for the detection of the driver's drowsiness condition.
Application: The proposed model would be useful to the development of drowsiness detection system that can provide early warning to the driver at the onset of drowsiness.
Keywords
Drowsy driving Fighting-off drowsiness Artificial neural network Electrocardiography Intelligent vehicle
Drowsy driving may lead to a vehicle crash on the road due to decreased capabilities in perception, cognition, and response to driving environments. The AAA Foundation for Traffic Safety (2018a) and the National Highway Traffic Safety Administration (2017) reported that drowsiness causes 8.8 to 9.5% of vehicle crashes and 2.3 to 2.5% of fatal crashes. Owens et al. (2018) found that drivers suffered drowsiness for over 3 minutes immediately prior to vehicle crashes. In addition, numerous studies have identified drowsiness as one of the causative factors of vehicle collisions throughout the world (He et al., 2017; Liang et al., 2017; Aidman et al., 2015). Therefore, the detection of drowsy driving is critical to prevent drowsiness-related vehicle accidents and to improve traffic safety.
Previous studies have researched on the detection of driver drowsiness using physiological signals including electrocardiography (ECG), electroencephalography (EEG), electromyography (EMG), and electrooculography (EOG). For example, Wang et al. (2018), Awais et al. (2017), and Rodriguez-Ibañez et al. (2012) observed significant changes in ECG signals (e.g., increase in mean inter-beat interval; decrease in low frequency power) when a driver experienced drowsiness. Nguyen et al. (2017) and Han and Chong (2016) found systematic changes in delta, theta and alpha of EEG signals when a driver felt drowsy. Sahayadhas et al. (2013) and Kurt et al. (2009) observed reduced EMG activity on trapezius muscle and chin muscles during drowsy driving. Lastly, Chen et al. (2015), Hu and Zheng (2009), and Kurt et al. (2009) observed slowed eyelid closure and increased duration of eye closure from EOG during drowsy driving.
Among the aforementioned physiological signals, ECG signal is considered a practical and reliable measure to detect drowsiness while driving. ECG signals refer to electrical potential activities of the heart (Combatalade, 2010; Malik et al., 1996). Due to advances in sensor technologies that allow sensors to be embedded in the steering wheel (Choi et al., 2018) or the driver's seat (Singh et al., 2016), ECG can now be measured with minimum driver interference unlike other physiological signals. Heart rate variability (HRV) derived from ECG signals is known to reflect ongoing internal state of a person (Piotrowski and Szypulska, 2017; Patel et al., 2011). The HRV measures extracted from ECG signals can be categorized in terms of time and frequency domains (Malik et al., 1996). The time domain measures included mean inter-beat interval (mean IBI), standard deviation of IBIs (SDNN), and root mean squared difference of adjacent IBIs (RMSSD). IBI is inversely related to heart rate which is the interval between successive heart beats. The frequency domain measures include power in low frequency (LF), power in high frequency (HF), and LF/HF ratio. Previous studies reported that drowsiness increased mean IBI, SDNN, RMSSD, and HF; but decreased LF and LF/HF (Awais et al., 2017; Piotrowski and Szypulska, 2017; Borghini et al., 2014; Miyaji, 2014; Sahayadhas et al., 2013; Rodriguez-Ibañez et al., 2012; Vicente et al., 2011; Lal and Craig, 2001).
Detecting the state change of a driver before the onset of drowsiness is important because it can provide effective measures to prevent vehicle accidents. A driver's state can change gradually from normal (awake) to drowsy during monotonous driving. A driver may attempt to stay alert to drive (fighting-off drowsiness) when he/she is starting to feel a light drowsiness. Since the fighting-off drowsy state is a pre-stage of drowsiness, detection of this state before a driver falls into deeper drowsiness is beneficial in two ways. First, it can warn a driver in a timely manner to prevent further development toward drowsy. This is more useful than waiting to signal the driver until he/she is actually drowsy, because it is difficult to return to the normal state after the onset of true drowsiness (AAA Foundation for Traffic Safety, 2018b; Sleep Health Foundation, 2011; Tefft, 2010). Second, it can be adapted to an autonomous vehicle so that driving control is automatically switched from the driver to the vehicle at the onset of the fighting-off drowsy state. Although the detection of this fighting-off drowsy state is important, it has not been comprehensively investigated since previous studies have focused on classifying driver's state into either normal or drowsy (Awais et al., 2017; Li et al., 2017; Chen et al., 2015; Sahayadhas et al., 2013).
The present study developed an artificial neural network (ANN) model, which is one of the supervised learning method, to classify the driver's state into three levels (normal, fighting-off drowsy, and drowsy) based on ECG signals. Due to the risks of allowing participants to drive on the road while drowsy, we recorded ECG signals using a driving simulator programmed for monotonous driving. HRV measures in the time (mean IBI, SDNN, and RMSSD) and frequency (LF, HF, and LF/HF) domains were quantified and performed data processing through normalization and selection of sensitive measures to deal with individual variations of heart response. The ANN model was trained using a feed-forward and back-propagation learning rule and evaluated in terms of overall accuracy, sensitivity, and specificity.
2.1 Participants
Forty-three university students (male: 25, female: 18) with driver's license in their 20s were voluntarily took part in the driving simulation experiment of this study. Their age ranged from 20 to 28 years with an average age of 23.14 years (SD: 1.55). The participants were healthy, had a normal or corrected-to-normal vision, and had no cardiovascular diseases, and took no medication. No sleep deprivation was reported on the day of the experiment. In addition, the participants were also asked to refrain from any alcohol and caffeine before participating in the experiments. All participants signed an informed consent form and were given a description of the experimental objectives and procedures.
2.2 Equipment
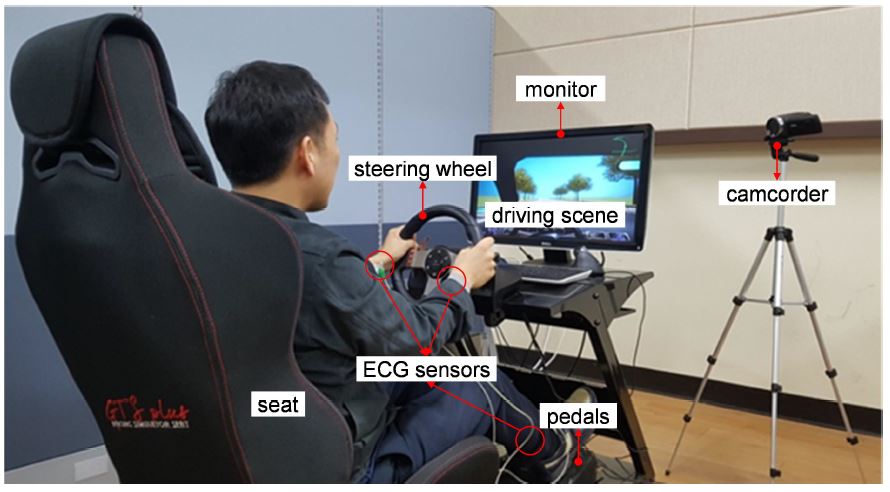
A driving simulator (Logitech G27 DriveTM, Switzerland) was used for the experiment of this study as shown in Figure 1. The driving simulator consisted of a seat, a steering wheel, a monitor, and two pedals for braking and acceleration. A simulated driving program (Driving Simulator 2012, Excalibur Publishing Limited, United Kingdom) was used to provide a driving scene to participants. To induce drowsiness, the driving scenario was monotonous driving (no other vehicle) on a two-lane highway at a speed of about 60 km/h for about 20 min. The length of monotonous driving task period adopted in the experiment of this study was based on earlier works (Nguyen et al., 2017; Li and Chung, 2013; Sahayadhas et al., 2012).
A desktop computer (Model 32MB25HM, LG Electronics Inc., South Korea) was used to connect the driving simulator with the driving program. In addition, a notebook computer (Model SENS R60F, Samsung Electronics Co., Ltd., South Korea) was utilized to process driver's ECG signal during simulated driving using a P400 digital physiograph device and iDaq-400 module (PhysioLab Co., South Korea). Three ECG electrodes were placed on both wrists and the right ankle of driver. The sampling rate was set to 500Hz. Lastly, a full HD handy camcorder (Model HDR-PJ675, Sony Corp., Japan) was used to continuously record driver's face during the entire experiment.
2.3 Experimental design
This study defined three driver's states: 1) normal, 2) fighting-off drowsiness, and 3) drowsy as listed in Table 1. First, we defined the normal state as a state of alertness or wakefulness in which the participant fully concentrates on the driving task. This condition was similar to drowsiness level 0 (which means not drowsy) that proposed by Wierwille and Ellsworth (1994). Wierwille and Ellsworth (1994) categorized the drowsiness levels into five levels (level 0: not drowsy, 1: slightly drowsy, 2: moderately drowsy, 3: very drowsy, 4: extremely drowsy). Second, the fighting-off drowsiness state was defined as a state in which the driver is attempting to remain alert to prevent falling into drowsiness. The fighting-off drowiness is an ongoing internal state (pre-stage) of drowsiness. This state can be regarded as: 1) a transient period from normal to drowsy (Schumann et al., 2017; Han and Chong, 2016; Sahayadhas et al., 2013) or 2) drowsiness level 1 (slightly drowsy) which is the onset stage of drowsiness as defined by Wierwille and Ellsworth (1994). Lastly, the drowsy state was referred as a state in which the participant is experiencing drowsy and has reduced attention on the driving task (Awais et al., 2017; Han and Chong, 2016; Sahayadhas et al., 2013). This condition can also be considered as drowsiness level equal to or higher than 2 (moderately drowsy).
|
State |
Drowsy
level |
Description |
|
Normal |
0 (alert or awake) |
A driver can fully concentrate on the driving task. |
|
Fighting-off drowsiness |
1 (slight drowsy) |
A driver needs an extra effort to keep the driving task. |
|
Drowsy |
³ 2 (moderately
drowsy) |
A driver experiences drowsy
and has reduced attention on the driving task. |
The experiment of this study was conducted in the two different time windows of the day (morning: 9:00 - 12:00; afternoon: 1:00 - 4:00) in the following five-step procedure. The experiment time windows considered in this study were related to the human circadian rhythms that have been confirmed in the existing studies (Chowdhury et al., 2018; Sahayadhas et al., 2012). First, each participant was explained about the objectives as well as procedures of the experiment and signed his/her consent. Second, three ECG electrodes were attached to a participant and a short practice driving was allowed for about 5~10min. to allow him/her to become accustomed to the driving environment. The experiment was done in a quiet room to diminish external disturbances and provide a situation conducive to drowsiness. Third, a participant was asked to drive under the driving scenario while recording his/her ECG signals. In addition, the participant was allowed a slight postural change while driving if needed. A video was recorded during driving to help determine participant's state. Since drowsiness is a hidden ongoing condition, the participant was asked to verbally notice his/her driving state (normal, fighting-off drowsiness, or drowsy) directly to the experimental instructor at the onset of each state while keep performing the driving task. The participant was instructed to inform his/her state with minimum notice to avoid distraction that may evoke any intentional bias. The experimenter recorded the onset time of driver's state on a prepared form. Fourth, after completion of the whole driving task, the participant was asked to rate his/her subjective drowsiness level using a 9-point Karolinska Sleepiness Scale (KSS) (1: extremely alert, 3: alert, 5: neither alert nor sleepy, 7: sleepy, no effort to stay awake, 9: very sleepy; Shahid et al., 2011). Lastly, a debriefing with the participant was conducted regarding the experiment results.
2.4 ECG analysis protocol
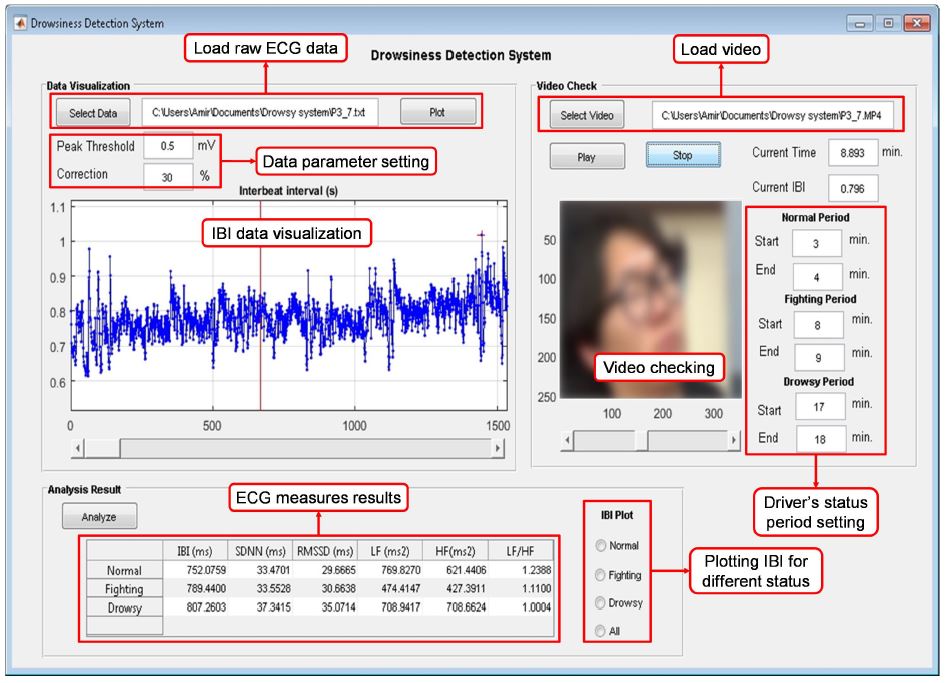
An analysis software was coded using Matlab R2017b (MathWorks, Inc., USA) to extract six measures in time and frequency domains for three different driver's states. The graphic user interface of the software consists of three panels: 1) data import, 2) video, and 3) analysis results, as shown in Figure 2. First, the data import panel allowed us to load ECG raw signal data into the system, set data processing parameters (peak threshold and outlier criterion), and visualize IBI of ECG signal. The threshold to identify R-peak points was customized for each participant, because the magnitudes of ECG signals varied among participants. The outlier criterion was employed to detect the outliers of IBI that were greater or less than the percentage of previous IBI. Second, the video panel was used to assess and validate the ground truth of driver's state during the experiment by integrating video evaluation and participants' subjective report. This panel was also utilized to accurately adjust the designated period of driver's state. Lastly, the analysis result panel was designed to display the analysis results of the six measures in time and frequency domains for each driver's state.
The ground truth of participants' state during experiment was identified through video recording and participants' subjective report. First of all, the video data and the ECG data recorded during experiment were synchronized. Next, facial features such as eye closure duration, head-nodding, and yawning were identified from the video recordings. Lastly, the participant's state was determined based on the facial features identified and was confirmed by the participant's subjective report recorded during experiment.
The six ECG measures in time and frequency domains were quantified in the following three steps. In the first step, the raw ECG signals for 1-min. (Takahashi et al., 2017; Sahayadhas et al., 2013; Li and Chung, 2013) of each period of driver's state (normal, fighting-off drowsiness, and drowsy) were selected based on the video recorded during experiment and participants' subjective report. In the second step, IBI data were calculated from the selected ECG raw signals using the R-peak detection algorithm (Billauer, 2012) coded in Matlab. In the third step, mean IBI (unit: ms), SDNN (unit: ms), RMSSD (unit: ms) in time domain were computed using Equation 1. Meanwhile, LF, HF, and LF/HF in frequency domain were obtained by fast Fourier transformation. The frequency bands for LF (0.04~0.15Hz; unit: ms2) and HF (0.15~0.4Hz; unit: ms2) were defined according to existing studies (Combatalade, 2010; Malik et al., 1996).
where: n = number of inter-beat intervals (IBI), and
=
inter-beat interval, and
= average of inter-beat intervals.
The quantified six ECG measures had different magnitude and unit among measures and participants. Hence, the ECG measures were normalized to obtain a common scale of values as well as enhance the classification performance. Since normalization with the middle state showed better classification results in Tjolleng et al. (2017), we performed the normalization of ECG measures for the three states (normal, fighting-off drowsiness, and drowsy) by dividing the participant's normal and drowsy data with his/her data from the fighting-off drowsiness state using Equation 2. The fighting-off drowsy state was considered as the normalization benchmark to easily discriminate the state of a participant. For example, a normalized ECG value of less than 1 indicated a normal state, while a normalized ECG value of greater than 1 indicated a drowsy state.
where: =
normalized data,
=
data, and
= fighting-off drowsy value (median).
The normalized ECG measures varied among participants due to individual differences in heart response (Hong et al., 2014; Lee et al., 2010; Lal and Craig, 2001). Thus, the measures need to be properly selected prior for use as inputs to establish an appropriate model with high accuracy. We manually selected two out of the six normalized ECG measures for each participant as significant inputs for the neural network models. This study selected the two most sensitive measures for each participant that were capable of clearly distinguishing the three states; further, the increasing/decreasing trends in these measures with respect to drowsiness agreed with existing studies. Existing studies (Awais et al., 2017; Piotrowski and Szypulska, 2017; Miyaji, 2014; Borghini et al., 2014; Sahayadhas et al., 2013; Rodriguez-Ibañez et al., 2012; Vicente et al., 2011; Lal and Craig, 2001) reported that with drowsiness, the mean IBI, SDNN, RMSSD, and HF increased; while, LF and LF/HF decreased.
2.5 Proposed ANN model
A standard feed-forward and back-propagation neural network model was constructed in Matlab to classify driver's state based on the two sensitive ECG measures. The ANN model was developed to classify the driver's state into three categories (normal, fighting-off drowsiness, and drowsy). The ANN model in this study consisted of three layers (input, hidden, and output) as shown in Figure 3. The layers of the ANN model were fully-connected layers in which neurons between two adjacent layers are fully pairwise connected.
The input layer had two units corresponding to the two most sensitive ECG measures in time and/or frequency domains. ECG measures that showed systematic increasing/decreasing trends as well as agreed with the existing studies were regarded as the sensitive measures. As aforementioned, the sensitive ECG measures were varied noticeably among participants because of the inter-individual variability. For example, a participant was sensitive in mean IBI and LF/HF as his/her state changed from normal to drowsy; while, another participant was sensitive in mean IBI and RMSSD for the same situation. The proportions selected as the sensitive measures of this study were mean IBI (95%), RMSSD (50%), LF/HF (40%) and SDNN (15%).
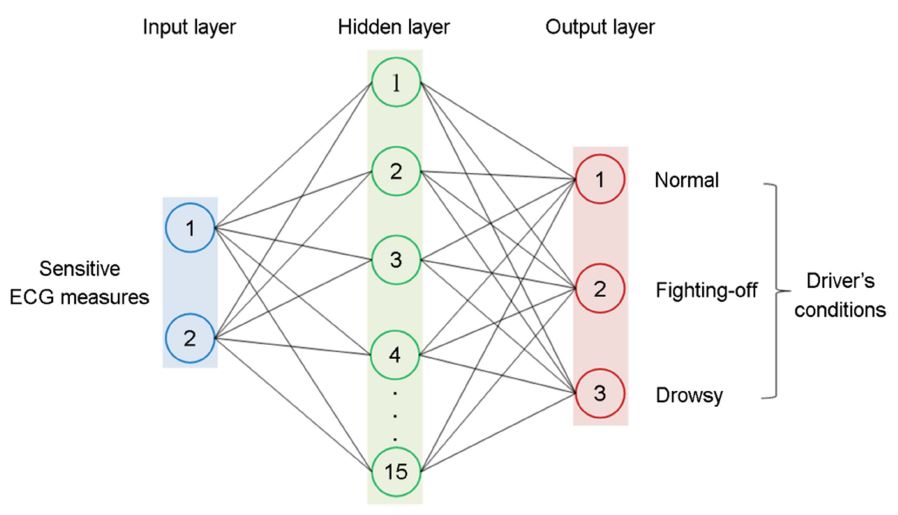
The classification accuracy of the networks is affected by the number of units in the hidden layer. Thus, an appropriate number of hidden units need to be determined. However, no standard and accepted rule exists for predetermining the optimal number of hidden units (Kurt et al., 2009; Acharya et al., 2003). The optimal number of hidden units in this study was determined through trials and errors by changing it from 5 to 30 with an interval of 5. The optimal number of the units in the hidden layer was 15 in this study. A hyperbolic tangent sigmoid transfer function with output range [-1, 1] was applied as the transfer function of the hidden layer.
The output layer of the ANN model had three units: normal, fighting-off drowsiness, and drowsy. The units of output layer were stimulated using softmax transfer function. A scaled conjugate gradient was utilized as learning function for the back-propagation method. In addition, a cross entropy function was utilized to evaluate the performance of the developed networks.
The data on the sensitive ECG measures of the twenty participants were randomly divided into a learning data set (70%) to develop networks by learning and adjusting unit weights of connection layers, and a testing data set (30%) to evaluate networks' performances. In addition, a cross evaluation program was coded in Matlab and executed for 100 times to validate the ANN models over both data sets. Lastly, the classification performance results were presented with confusion matrix in terms of overall accuracy, sensitivity (true positive rate), and specificity (true negative rate).
2.6 Statistical analysis
One-factor within-subjects analysis of variance (ANOVA) was conducted using Minitab v17.0 (Minitab Inc., USA) at α = 0.05. The independent variables were the driver's state (three levels: normal, fighting-off drowsiness, and drowsy). The dependent variables were the six normalized ECG measures in time (mean IBI, SDNN, and RMSSD) and frequency domains (LF, HF, and LF/HF). For post-hoc analysis, Tukey tests were conducted at the same significance level. Lastly, to compare the drowsiness level measured using KSS between drowsy group and non-drowsy group, one-factor (two levels: drowsy group and non-drowsy group) between-subject ANOVA was performed at α = 0.05.
3.1 Subjective drowsiness scores
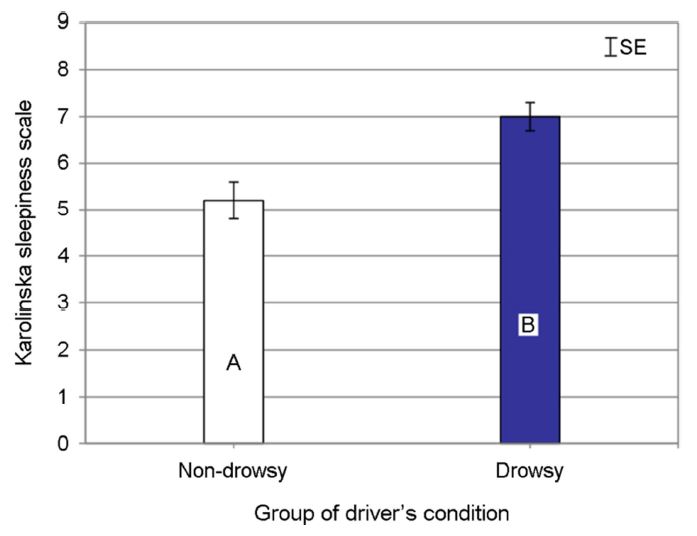
Twenty participants (male: 13, female: 7) out of forty-three experienced drowsy during the monotonous driving in this study. Their average age and range were 23.2 (SD: 1.3) and 20~25, respectively. Those participants were regarded as a drowsy group and their data was used for ECG analysis and development of an ANN model. The remaining participants were regarded as a non-drowsy group and excluded for further analysis since they did not exhibit any sign of drowsy during the driving task. The exclusion was confirmed based on the participant's subjective report on drowsiness level and video recording analysis. As a result, average self-reported drowsiness level for the drowsy group was significantly higher (mean ± SE; 7.1±0.3 pt., which means sleepy and some effort to keep awake) than that of the non-drowsy group (5.2±0.4 pt., which means neither alert nor sleepy) as shown in Figure 4 (F(1, 41) = 14.16, p = 0.001).
3.2 ECG Measures
All ECG measures except SDNN and LF differed significantly by driver's state as shown in Figure 5 (mean IBI: F(2, 38) = 43.77, p < 0.001; RMSSD: F(2, 38) = 4.95, p = 0.012; HF: F(2, 38) = 9.99, p < 0.001; and LF/HF: F(2, 38) = 10.49, p < 0.001). The results indicated that mean IBI, SDNN, RMSSD, and HF increased as the drowsy level elevated (from normal to drowsy), while LF and LF/HF decreased. Although SDNN tended to increase as the drowsiness level elevated, it did not show a significant difference (SDNN: F(2, 38) = 2.11, p = 0.135). Similarly, LF decreased as the drowsy levels changed; however, it the change was not statistically significant (LF: F(2, 38) = 0.47, p = 0.629).
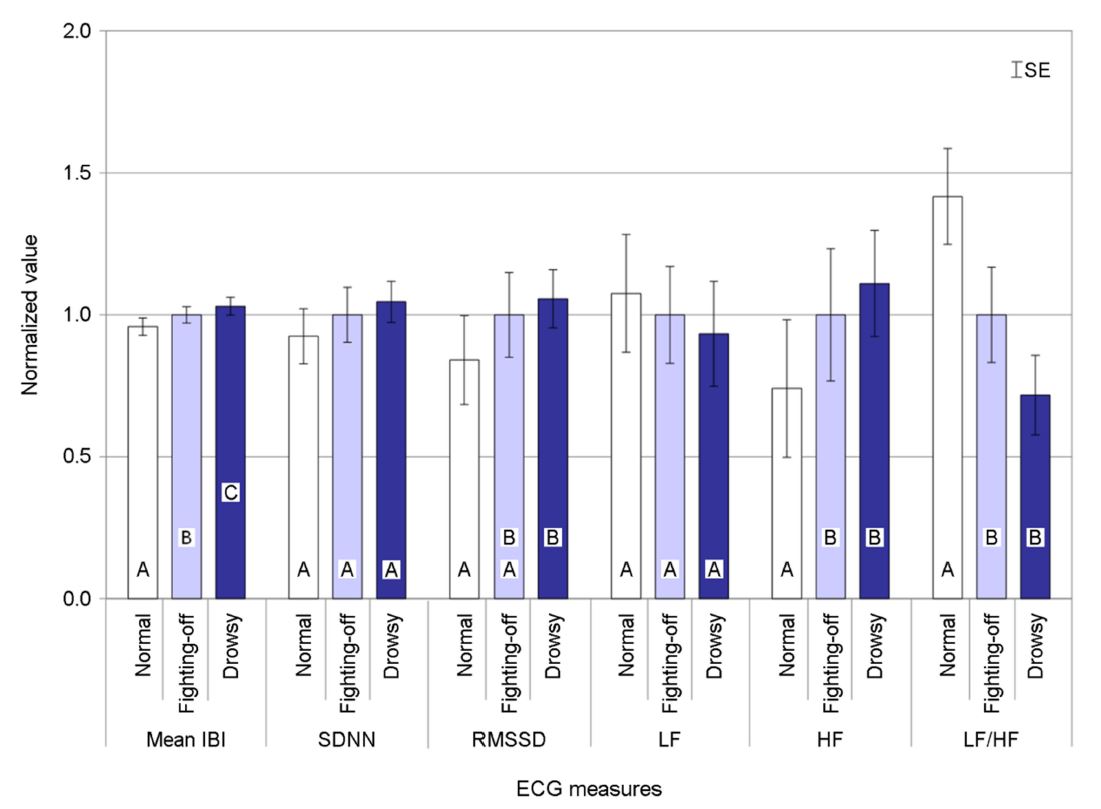
Tukey tests categorized participants' state into groups as shown in Figure 5. Normal, fighting-off drowsiness, and drowsy states in mean IBI were statistically classified into a lower group, a medium group, and a higher group, respectively. On the other hand, the normal and fighting-off drowsiness states in RMSSD were classified into a lower group; while fighting-off drowsiness and drowsy states were grouped into a higher group. Next, the normal driving state in HF was classified into a lower group, while fighting-off drowsiness and drowsy states were grouped into a higher group. Conversely, the normal state in LF/HF was classified into a higher group, while fighting-off drowsy and drowsy states were grouped into a lower group.
3.3 Performance of ANN model
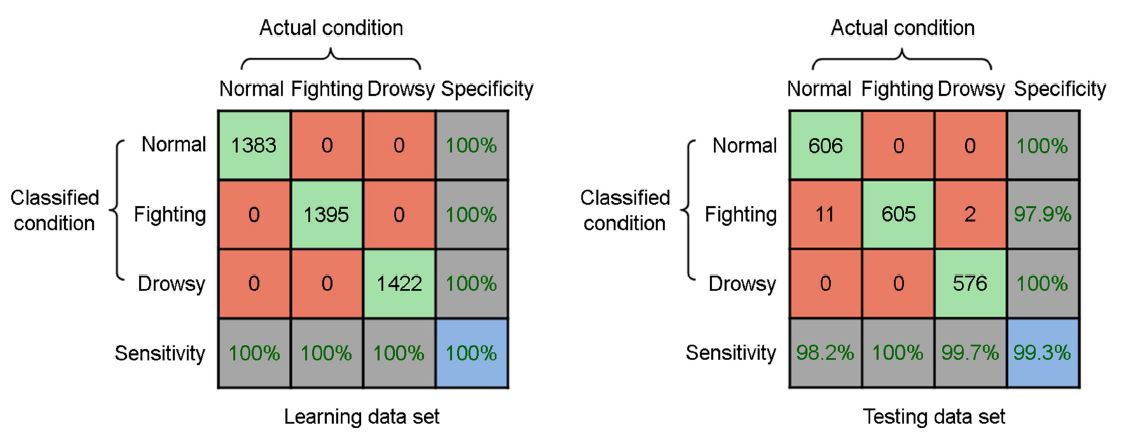
The classification accuracies of the developed ANN model of this study were satisfactory for both of the learning and testing data sets. Average classification accuracies for the learning and testing sets of the ANN model were 100% and 99.3% (SD = 2.0%), respectively. The sensitivity and specificity for both data sets were varied between 97.9% and 100%. The confusion matrixes of the ANN model are depicted in Figure 6. Each row of the matrix corresponds to a classified class, while each column of the matrix represents to an actual class. All correct predictions are located in the diagonal matrix. For example, in the testing data, it can be observed that 606 out of 617 normal driving cases were correctly classified as normal. Meanwhile, 11 normal driving cases were incorrectly classified as fighting-off drowsiness. The lower right blue squares of each confusion matrix indicate average classification accuracies. In addition, the sensitivity (the true positive rate in the bottom row of confusion matrix) and specificity (the true negative rate in the right column of confusion matrix) of the proposed ANN models revealed no systematic bias for either the learning or testing data sets.
An ANN model was constructed in this study to correctly classify driver's state into three categories (normal, fighting-off drowsiness, and drowsy) based on ECG signals. The fighting-off drowsiness state of this study was referred as a transition condition from normal to drowsy in which a driver struggles against drowsiness. The ECG measures for each state were normalized by the fighting-off drowsiness state to obtain a common magnitude among measures. In addition, two most sensitive ECG measures for each participant from either time-domain (mean IBI, SDNN, and RMSSD) or frequency-domain (LF, HF, and LF/HF) measures were selected as input to the ANN model. The ANN model showed high classification accuracies for both learning and testing data sets.
In this study, the classification accuracy of the developed ANN model with three outputs level (training: 100%; testing: 99.3% (SD: 2.0%)) was higher than in the existing studies. For example, Awais et al. (2017) and Li and Chung (2013) employed ECG signals to classify the driver state (either alert or drowsy) using support vector machine (SVM) and reported a classification accuracy of 70% and 95%, respectively. Next, Tsuchida et al. (2010) used ECG to identify the driver state (either alert or drowsy) using neural network-based decoding error-correcting output coding (ECOC) with accuracy 96.76%. Lastly, Hayashi et al. (2005) also used ECG to estimate driver drowsiness state using ANN (use of only 3 hidden neurons) and achieved accuracies from 74 to 88%. The ANN model of this study showed better accuracy compared to the ANN model of Hayashi et al. (2005) since this study utilized more complex network (use of 15 hidden neurons) and normalization technique to compensate individual differences in heart response. Although the accuracy of the ANN model developed in this study outperformed existing studies, a careful interpretation is needed. The accuracy can be affected by various factors (e.g., data collection protocol, ECG measures, and ANN topology); therefore, the comparison made in this study should be cautiously interpreted.
Alteration of driver's state from normal to drowsy during monotonous driving task significantly affected to mean IBI. For instance, the normalized mean IBI in this study was 0.96 for the normal state, 1.00 for fighting-off drowsiness state, and 1.03 for drowsy state. These results were expected since drowsiness is associated with a reduction of oxygen demand and leads to a drop in cardiac output through slowed heart rate. Since heart rate is inversely proportional to mean IBI, an increased drowsiness level led to increasing mean IBI. This trend agreed with the results reported in previous researches (Borghini et al., 2014; Sahayadhas et al., 2013; Rodriguez-Ibañez et al., 2012; Lal and Craig, 2001).
As expected, other time-domain measures (SDNN and RMSSD) also increased with an increase in the level of drowsiness, which can be explained by the role of the sympathetic and parasympathetic nervous system. Under drowsiness, the parasympathetic nervous is activated, leading to a fluctuation in heart rate (Low, 2013; Malik et al., 1996). Conversely, in an alert state, the sympathetic nervous is activated and stabilizes heart rate and cardiac outputs.
HF and LF/HF changed in the opposite way as driver's condition changed from normal to drowsy. The pattern of changes in HF and LF/HF can be explained by the autonomic modulation of the human cardiac function. LF and HF are regulated by the sympathetic and parasympathetic nervous system, respectively. Those two nervous systems work in an opposite way to balance the cardiac system (Piotrowski and Szypulska, 2017). For example, the parasympathetic nervous system controls the human body in the resting condition (e.g., slowed heart rate and/or reducing blood pressure) and dominates during sleep. When a driver is drowsy due to a prolonged driving task, his/her parasympathetic system is activated and causes an increase of HF. Therefore, as the driver condition changed from normal to drowsy, HF significantly increased, while LF and LF/HF decreased. These trends were consistent with earlier findings (Awais et al., 2017; Piotrowski and Szypulska, 2017; Miyaji, 2014; Sahayadhas et al., 2013; Rodriguez-Ibañez et al., 2012; Vicente et al., 2011; Lal and Craig, 2001).
Although this study has delivered promising results, further researches are warranted for better generalization of the findings. First, an in-depth experiment considering age groups, gender, population, and driving experience is suggested as a part of future research to comprehensively figure out their effects. Second, this study used a monotonous driving task to induce drowsiness. However, the drowsiness levels are strongly associated with the inducement task (Chowdhury et al., 2018; Sahayadhas et al., 2012). Therefore, the effect of various drowsiness inducement tasks on ECG measures and perceived drowsiness levels need to be investigated in a follow-up study. Third, the generalization of the results found in this study are limited to a monotonous driving task performed in a driving simulator. Therefore, a future work should address a field study to validate the results obtained by the lab study. Lastly, to implement the proposed ANN model to cars, a protocol of selecting two sensitive ECG measures for a driver is needed. Therefore, a feasible and convenient protocol to select two sensitive measures should be developed and its effectiveness needs to be studied.
This study proposed an artificial neural network (ANN) model to accurately classify driver's state into one of three levels (normal, fighting-off drowsiness, and drowsy) based on electrocardiography (ECG) signals. The participant's ECG signals were measured while doing a monotonous driving task in a driving simulator. ECG measures were quantified in time and frequency domains using the ECG signals. Next, the ECG measures were normalized and two most sensitive measures to compensate for individual variability in heart response. The ANN model was established using a feed-forward neural network and was assessed through repeated cross-evaluation. As a result, mean IBI, SDNN, RMSSD, and HF of ECG measures increased as the drowsy level elevated (from normal to drowsy), while LF and LF/HF decreased. In addition, the classification accuracies (>99%) of the proposed ANN model with three outputs levels was satisfactory for both the learning and testing data sets. We expect that the ANN model proposed in this study would be helpful in the development of drowsiness detection system to prevent traffic collisions as well as to improve traffic safety.
References
1. AAA Foundation for Traffic Safety. Prevalence of drowsy driving crashes: estimates from a large-scale naturalistic driving study. (Retrieved March 27, 2018 from http://aaafoundation.org), 2018a.
Google Scholar
2. AAA Foundation for Traffic Safety. 2017 Traffic Safety Culture Index. AAA Foundation for Traffic Safety, 2018b.
3. Acharya, U.R., Bhat, P.S., Iyengar, S.S., Rao, A. and Dua, S., Classification of heart rate data using artificial neural network and fuzzy equivalence relation. Pattern Recognition, 36, 61-68, 2003.
Google Scholar
4. Aidman, E., Chadunow, C., Johnson, K. and Reece, J., Real-time driver drowsiness feedback improves driver alertness and self-reported driving performance. Accident Analysis & Prevention, 81, 8-13, 2015.
Google Scholar
5. Awais, M., Badruddin, N. and Drieberg, M., A hybrid approach to detect driver drowsiness utilizing physiological signals to improve system performance and wearability. Sensors, 17(9), 1991, 2017.
Google Scholar
6. Billauer, E., Peak detection using MATLAB. (Retrieved July 20, 2012 from http://www.billauer.co.il/peakdet.html), 2012.
7. Borghini, G., Astolfi, L., Vecchiato, G., Mattia, D. and Babiloni, F., Measuring neurophysiological signals in aircraft pilots and car drivers for the assessment of mental workload, fatigue and drowsiness. Neuroscience & Biobehavioral Reviews, 44, 58-75, 2014.
Google Scholar
8. Chen, L.L., Zhao, Y., Zhang, J. and Zou, J.Z., Automatic detection of alertness/drowsiness from physiological signals using wavelet-based nonlinear features and machine learning. Expert Systems with Applications, 42(21), 7344-7355, 2015.
Google Scholar
9. Choi, Y.J., Lee, J.Y. and Kong, S.H., Driver ECG Measuring System with a Conductive Fabric-Based Dry Electrode. IEEE Access, 6, 415-427, 2018.
Google Scholar
10. Chowdhury, A., Shankaran, R., Kavakli, M. and Haque, M.M., Sensor applications and physiological features in drivers' drowsiness detection: A Review. IEEE Sensors Journal, 18(8), 3055-3067, 2018.
Google Scholar
11. Combatalade, D.C., Basics of Heart Rate Variability Applied to Psychophysiology. Thought Technology Ltd., Canada, 2010.
12. Han, H. and Chong, U., Neural Network Based Detection of Drowsiness with Eyes Open using AR Modelling. IETE Technical Review, 33(5), 518-524, 2016.
Google Scholar
13. Hayashi, K., Ishihara, K., Hashimoto, H. and Oguri, K., "Individualized drowsiness detection during driving by pulse wave analysis with neural network", In Intelligent Transportation Systems, 2005. Proceedings. 2005 IEEE (pp. 901-906). IEEE, 2005.
Google Scholar
14. He, J., Choi, W., Yang, Y., Lu, J., Wu, X. and Peng, K., Detection of driver drowsiness using wearable devices: A feasibility study of the proximity sensor. Applied Ergonomics, 65, 473-480, 2017.
Google Scholar
15. Hong, W., Lee, W., Jung, K., Lee, B., Park, J., Park, S., Park, Y., Son, J., Park, S. and You, H., Development of an ECG-based assessment method for a driver's cognitive workload. Journal of the Korean Institute of Industrial Engineers, 40(3), 325-332, 2014.
Google Scholar
16. Hu, S. and Zheng, G., Driver drowsiness detection with eyelid related parameters by Support Vector Machine. Expert Systems with Applications, 36(4), 7651-7658, 2009.
Google Scholar
17. Kurt, M.B., Sezgin, N., Akin, M., Kirbas, G. and Bayram, M., The ANN-based computing of drowsy level. Expert Systems with Applications, 36(2), 2534-2542, 2009.
Google Scholar
18. Lal, S.K.L. and Craig, A., A critical review of the psychophysiology of driver fatigue. Biological Psychology, 55, 173-194, 2001.
Google Scholar
19. Lee, W., Jung, K., Hong, W., Park, S., Park, Y., Son, J., Park, S. and Kim, K, "Analysis of drivers' ECG biological signal under different levels of cognitive workload for intelligent vehicle", Proceedings of the 2010 Fall Conference of Ergonomics Society of Korea, 2010.
20. Liang, Y., Horrey, W.J., Howard, M.E., Lee, M.L., Anderson, C., Shreeve, M.S., O'Brien, C.S. and Czeisler, C.A., Prediction of drowsiness events in night shift workers during morning driving. Accident Analysis & Prevention, 2017. http://dx.doi.org/10.1016/ j.aap.2017.11.004.
Google Scholar
21. Li, G. and Chung, W.Y., Detection of driver drowsiness using wavelet analysis of heart rate variability and a support vector machine classifier. Sensors, 13(12), 16494-16511, 2013.
Google Scholar
22. Li, Z., Zhang, Q. and Zhao, X., Performance analysis of K-nearest neighbor, support vector machine, and artificial neural network classifiers for driver drowsiness detection with different road geometries. International Journal of Distributed Sensor Networks, 13(9), 1-12, 2017.
Google Scholar
23. Low, P., Overview of the Autonomic Nervous System. Home Health Handbook, 2013. Retrieved from http://www.merckmanuals.com /home/brain_spinal_cord_and_nerve_disorders/autonomic_nervous_system_disorders/overview_of_the_autonomic_nervous_system.html
24. Malik, M., Camm, A.J., Bigger, J.T.G, Breithardt, G., Cerutti, S., Cohen, R.J., Coumel, P., Fallen, E.L., Kennedy, H.L., Kleiger, R.E., Lombardi, F., Malliani, A., Moss, A.J., Rottman, J.N., Schmidt, G., Schwartz, P.J. and Singer, D.H., Heart rate variability: standards of measurement, physiological interpretation, and clinical use. European Heart Journal, 17, 354-381, 1996.
25. Miyaji, M., Method of drowsy state detection for driver monitoring function. International Journal of Information and Electronics Engineering, 4(4), 264, 2014.
Google Scholar
26. National Center for Statistics and Analysis. Drowsy Driving 2015 (Crash-Stats Brief Statistical Summary. Report No. DOT HS 812 446). Washington, DC: National Highway Traffic Safety Administration, 2017.
27. Nguyen, T., Ahn, S., Jang, H., Jun, S.C. and Kim, J.G., Utilization of a combined EEG/NIRS system to predict driver drowsiness. Scientific Reports, 7, 43933, 2017.
Google Scholar
28. Owens, J.M., Dingus, T.A., Guo, F., Fang, Y., Perez, M., McClafferty, J. and Tefft, B., Prevalence of Drowsy Driving Crashes: Estimates from a Large-Scale Naturalistic Driving Study. (Research Brief.) Washington, D.C.: AAA Foundation for Traffic Safety, 2018.
Google Scholar
29. Patel, M., Lal, S.K., Kavanagh, D. and Rossiter, P., Applying neural network analysis on heart rate variability data to assess driver fatigue. Expert Systems with Applications, 38(6), 7235-7242, 2011.
Google Scholar
30. Piotrowski, Z. and Szypulska, M., Classification of falling asleep states using HRV analysis. Biocybernetics and Biomedical Engineering, 37(2), 290-301, 2017.
Google Scholar
31. Rodriguez-Ibañez, N., García-Gonzalez, M.A., de la Cruz, M.A.F., Fernández-Chimeno, M. and Ramos-Castro, J., Changes in heart rate variability indexes due to drowsiness in professional drivers measured in a real environment. In Computing in Cardiology (CinC), 2012 (pp. 913-916). IEEE, 2012.
32. Sahayadhas, A., Sundaraj, K. and Murugappan, M., Detecting driver drowsiness based on sensors: A review. Sensors, 12(12), 16937-16953, 2012.
Google Scholar
33. Sahayadhas, A., Sundaraj, K. and Murugappan, M., Drowsiness detection during different times of day using multiple features. Australasian Physical and Engineering Sciences in Medicine, 36(2), 243-250, 2013.
Google Scholar
34. Schumann, A., Ebel, J. and Bär, K.J., Forecasting transient sleep episodes by pupil size variability. Current Directions in Biomedical Engineering, 3(2), 58, 2017.
Google Scholar
35. Shahid, A., Wilkinson, K., Marcu, S. and Shapiro, C.M., Karolinska sleepiness scale (KSS). In STOP, THAT and One Hundred Other Sleep Scales (pp. 209-210). Springer, New York, NY, 2011.
Google Scholar
36. Singh, R.K., Sarkar, A. and Anoop, C.S., "A health monitoring system using multiple non-contact ECG sensors for automotive drivers", In Instrumentation and Measurement Technology Conference Proceedings (I2MTC), 2016 IEEE International (pp. 1-6). IEEE, 2016.
Google Scholar
37. Sleep Health Foundation. Drowsy Driving 2011. Retrieved from https://www.sleephealthfoundation.org.au/pdfs/drowsy-driving.pdf.
38. Takahashi, N., Kuriyama, A., Kanazawa, H., Takahashi, Y. and Nakayama, T., Validity of spectral analysis based on heart rate variability from 1-minute or less ECG recordings. Pacing and Clinical Electrophysiology, 40(9), 1004-1009, 2017.
Google Scholar
39. Tefft, B.C., Asleep at the wheel: The prevalence and impact of drowsy driving. AAA Foundation for Traffic Safety, 2010.
Google Scholar
40. Tjolleng, A., Jung, K., Hong, W., Lee, W., Lee, B., You, H., Son, J. and Park, S., Classification of a driver's cognitive workload levels using artificial neural network on ECG signals. Applied Ergonomics, 59, 326-332, 2017.
Google Scholar
41. Tsuchida, A., Bhuiyan, M.S. and Oguri, K., "Estimation of drivers' drowsiness level using a Neural Network Based 'Error Correcting Output Coding'method", In Intelligent Transportation Systems (ITSC), 2010 13th International IEEE Conference on (pp. 1887-1892). IEEE, 2010.
Google Scholar
42. Vicente, J., Laguna, P., Bartra, A. and Bailón, R. Detection of driver's drowsiness by means of HRV analysis. In Computing in Cardiology, 2011 (pp. 89-92). IEEE, 2011.
Google Scholar
43. Wang, F., Wang, H. and Fu, R., Real-Time ECG-Based Detection of Fatigue Driving Using Sample Entropy. Entropy, 20(3), 196, 2018.
Google Scholar
44. Wierwille, W.W. and Ellsworth, L.A., Evaluation of driver drowsiness by trained raters. Accident Analysis & Prevention, 26(5), 571-581, 1994.
Google Scholar
PIDS App ServiceClick here!