eISSN: 2093-8462 http://jesk.or.kr
Open Access, Peer-reviewed
eISSN: 2093-8462 http://jesk.or.kr
Open Access, Peer-reviewed
Daeyong Yang
, Eui Seung Jung
10.5143/JESK.2023.42.4.401 Epub 2023 August 30
Abstract
Objective: This study investigates the effects of various filter types on data obtained from a webcam-based 3D gait analysis system.
Background: Traditional motion capture systems, such as those utilizing infrared optical motion capture cameras or IMU sensors, are not only costly but also invasive. By employing a standard RGB camera with OpenPose, an open-source system for human body segment detection, it is possible to explore alternative options for professional motion capture systems. However, the resulting data often exhibit significant noise, necessitating the application of suitable filters and parameters.
Method: Body segment coordinates were acquired during two complete gait cycles while subjects walked at a speed of 5km/h. The data were subsequently filtered using four distinct filter types: Butterworth, Gaussian, LOESS, and Median filters, each with varying parameters. The processed data were utilized for inverse kinematics calculations to determine the angles of the hip, knee, and ankle joints.
Results: The application of a 2nd or 4th order low-pass Butterworth filter, with cutoff frequencies ranging from 2 to 15Hz, a Gaussian filter with sigma values between 5 and 10, and a LOESS filter with window sizes of 5 to 20 resulted in smooth movements. Furthermore, the low-pass Butterworth filter, with cutoff frequencies between 5 and 15Hz, exhibited the most seamless motion and yielded low RMSE values. While the Median filter with a window size of 9 produced the lowest overall RMSE value, it failed to effectively remove continuous noise throughout the data, resulting in unnatural movements.
Conclusion: When filtering gait data obtained from a webcam-based system, utilizing filter parameters within the suggested ranges for each filter type can promote both fluent motion and accurate angle values.
Application: The findings of this study provide threshold guidelines for each filter type within a webcam-based gait analysis system.
Keywords
Gait analysis Webcam-based motion capture OpenPose
사람의 행동을 인식하고 이를 데이터화 하는 모션 캡처 기술은 스포츠와 의료분야 뿐만 아니라 인간공학에서도 주요 기술로써 사용되어 왔다. 이 중에서도 사람의 보행 패턴은 파킨슨병과 같은 근골격계 질환의 진단기준이 될 뿐만 아니라 근로자의 육체적 또는 정신적 피로 수준을 판단할 수 있는 근거가 될 수 있기 때문에, 보행분석은 인간공학에서 오랜 기간 다양한 방법으로 연구되어 왔다(Karvekar et al., 2021; Salarian et al., 2004).
기존 많은 연구에서 주로 몸에 부착된 마커를 적외선 카메라를 사용하여 인식해 움직임을 추적하는 광학식 장비를 사용하거나 관성식 센서(IMU)를 몸에 직접 부착하는 방식으로 모션 캡처를 주로 진행하였다(Ekanayake et al., 2015; Rouhandeh et al., 2014; Sabatini et al., 2005; Salarian et al., 2004; Schepers et al., 2007; Seel et al., 2014). 이러한 장비들은 높은 정확도로 측정이 가능하지만, 가격이 매우 비싸며 신체에 마커 또는 센서를 직접 부착해야 하기 때문에 측정 대상자의 움직임에 직접적인 영향을 줄 수 있기 때문에 간섭이 없는 측정 방식의 필요성이 제기되어 왔다(Yu et al., 2019).
지난 몇 년간 빠르게 발전해온 OpenPose와 같은 컴퓨터 비전 기술은 낮은 비용 뿐만 아니라 몸에 직접 부착하는 센서 없이도 사람의 자세를 추적할 수 있는 시스템을 구축할 수 있는 발판을 만들어주었으며(Cao et al., 2017; Hidalgo et al., 2019), 이를 활용하여 실제로 일반적인 비디오(RGB) 카메라 또는 스테레오(RGB-D) 카메라를 활용해 사람의 다양한 자세를 측정하고 인간공학 측면에서 활용하는 것을 기존 연구를 통해 확인할 수 있다(Kim et al., 2021; Liu and Chang, 2022).
하지만, 몸에 직접 센서를 부착하는 방식과 달리 일반적인 카메라를 사용하는 방식에는 몇 가지 치명적인 단점이 있다. 먼저 두 개의 카메라를 사용해 보행분석을 진행한 기존 연구에 따르면 카메라에서 보여지지 않는 부분의 정확도가 급격하게 하락하는 것을 확인할 수 있었다(D'Antonio et al., 2021). 또한, 사람의 체형이나 옷, 또는 악세사리에도 영향을 받아 많은 노이즈가 발생되며 데이터 왜곡되어 골격이 실제와 다르게 인식되는 현상이 발생할 수 있다(Lin et al., 2020; Tsai and Hsu, 2019). 따라서, 정확한 데이터를 얻기 위해서는 사각지대를 줄이기 위해 다양한 각도에서 촬영할 뿐만 아니라 노이즈를 적절하게 제거하는 과정이 필수적이다. 하지만, 지나치게 노이즈를 제거하는 경우 기존 데이터의 주요한 특성까지 왜곡되는 현상이 발생할 수 있기 때문에 상황에 따른 적절한 필터링 방식과 수준이 고려되어야 한다.
따라서, 본 연구를 통해 웹캠 기반의 저비용 3D 보행분석 시스템을 구축하여 모션 데이터를 수집한 뒤, 몇 가지의 대표적인 아날로그 및 디지털 방식 필터와 그것들의 parameter 값을 다르게 조정하여 신체 관절의 최대 및 최소 값 등의 모션 데이터의 주요 특성을 유지하는 동시에 자연스러운 움직임을 만들 수 있는 필터의 종류와 parameter 수준을 제시하고자 한다.
2.1 Data collection
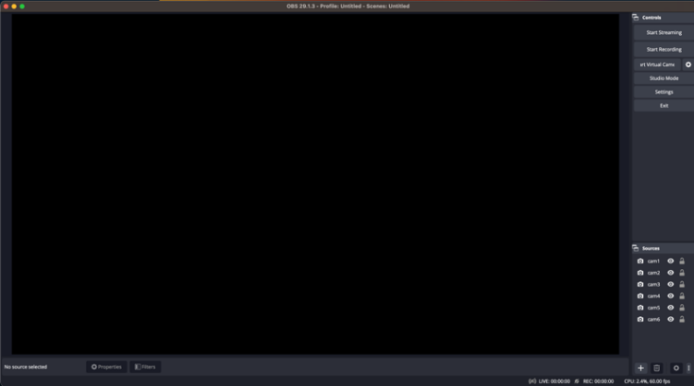
실내 공간에 설치된 워킹패드를 중심으로 반경 5m의 원에 2m 높이의 삼각대를 60도 간격으로 배치하여 총 6대의 동일한 웹캠(60fps, 1,080p)을 설치하였다. 이 후, 영상 녹화 및 방송용 오픈소스 프로그램인 OBS Studio (Oepn Broadcaster Software) (Figure 1)를 사용하여 카메라간 지연 보정을 진행해 실시간으로 동일 프레임이 기록되도록 설정하였다.
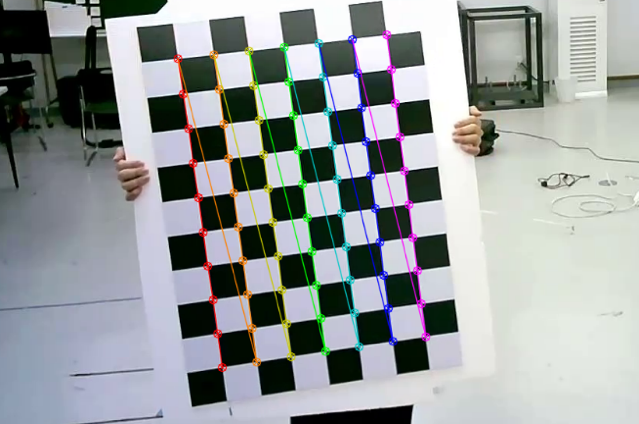
각 카메라의 내부 보정을 위해 체커보드(Figure 2)를 기준으로 왜곡 보정을 진행하였다(De La Escalera and Armingol, 2010; Yan et al., 2018). 또한, 서로 다른 위치에 배치된 카메라에서 보여지는 공통된 실내 구조물 등을 기준으로 이차원 이미지를 삼차원으로 재투영(reprojection)하며, 이 때 발생하는 오류를 줄이기 위한 외부 보정을 위해 OpenCV의 solvePnP를 적용하였다.
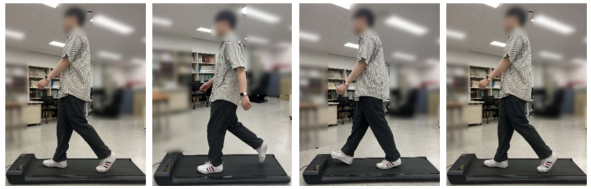
이후, 3명의 남성이 각각 워킹패드를 사용하여 정지상태에서 10초 당 1km/h씩 속도를 증가시켜 5km/h에 도달한 후, 30초 뒤 오른발의 뒤꿈치가 떨어지기 시작한 시점을 기준(Figure 3)으로 총 두 번의 걸음걸이를 기록하였다.
6대의 카메라를 통해 기록된 영상에서 25개의 신체 부위의 위치를 예측하는 Body-25B 모델(Hidalgo et al., 2019)을 기반으로 2차원에서의 좌표(x, y)를 추출하였으며, 내부 보정 과정에서 도출한 카메라 메트릭스(matrix) 및 왜곡 계수 값, 그리고 외부 보정을 통해 도출된 rotation과 translation 벡터를 기준으로 삼각법(triangulation) 과정을 거쳐 6개 세트의 2D 좌표를 1개의 3D 좌표(x, y, z)로 변환하였다.
2.2 Filtering algorithms
본 연구에서는 원본 데이터에 Butterworth, Gaussian, LOESS, 그리고 Median 필터 등 4가지의 필터를 적용하였다. 이 중 Butterworth filter는 1930년 Stephen Butterworth에 의해 제안되었으며, 현재 신호 처리에 가장 많이 사용되고 있는 선형(linear) 필터 중 하나이다(Butterworth, 1930; Mahata et al., 2018). Transfer function을 사용하는 무한 임펄스 응답 필터로 필터의 차수(Order)를 나타내는 n이 증가함에 따라 차단주파수(cutoff frequency)인 ωc 값 이외의 신호를 가파르게 제거하게 되며, 본 연구에서는 이 방식을 활용하여 low pass Butterworth filter를 적용하였다.
Gaussian filter는Gaussian 커널과 합성곱(convolution)하여 신호를 처리하는 선형 필터이며, 커널의 표준 편차인 σ 값을 통해 차단주파수를 조정하여 데이터의 주요한 특성을 유지하고 smoothing 할 때 주로 사용된다(Young and Van Vliet, 1995).
LOESS (Locally Estimated Scatterplot Smoothing)는 가중 다항식(weighted polynomial equation)을 사용하는 비선형(non-linear) smoothing filter로 가중 선형 최소 제곱법((weighted least squares)과 이웃한(neighboring) 데이터 기반의 국소 회귀(locally weighted regression)를 함께 사용하여 데이터의 트렌드를 예측한다(Cleveland and Devlin, 1988). 이러한 특성으로 인해 데이터가 비선형 관계를 갖거나 노이즈가 많은 경우 사용되지만 전체 프레임 중 window 크기의 비율을 나타내는 h를 너무 작게 설정할 경우 과적합(overfitting)이 발생하거나 너무 클 경우 더 많은 노이즈가 발생할 수 있기 때문에 적절한 값을 지정하는 것이 중요하다(Chen et al., 2004).
또 다른 비선형 필터인 Median filter는 각 데이터의 값을 지정한 window 값인 k 내에서의 중앙값으로 대치하는 방식으로 smoothing을 진행하며, 간헐적으로 발생하는 노이즈 또는 이상치를 효과적으로 줄이는 것과 동시에 신호의 sharp edge와 같은 디테일을 보존할 때 효과적이지만 지속적으로 발생하는 노이즈를 제거하는 성능은 한정적이다(Hwang and Haddad, 1995; Justusson, 1981).
2.3 Data analysis
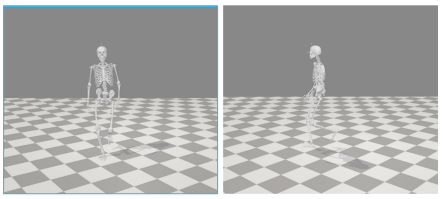
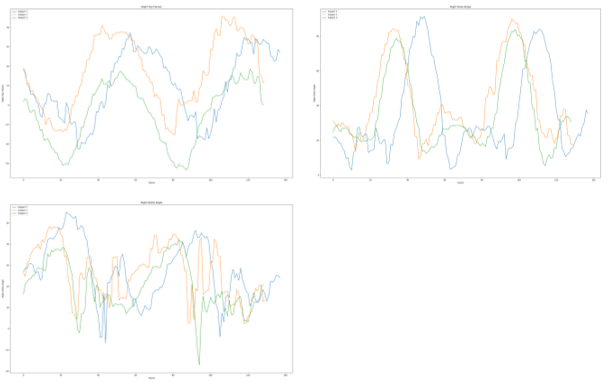
필터가 적용되지 않은 데이터와 위 4가지 필터에서 parameter를 다르게 적용한 데이터를 각각 오픈소스 소프트웨어인 OpenSim (Delp et al., 2007)을 사용하여 Inverse kinematics를 진행하였으며(Figure 4), 총 21가지 관절각을 도출하였다. 이 중 보행분석 시 가장 중요한 pelvis와 femur 사이의 hip joint flexion(및 hyperextension), femur와 tibia 사이인 knee joint flexion, 그리고 tibia와 talus 사이의 ankle plantarflexion(및 dorsiflexion) 등 3가지 관절각의 우측 값(Figure 5)을 기준으로 하여 영상을 통해 직접 측정한(manual evaluation) 최대 및 최소 각도와 각 필터의 결과를 RMSE 값을 사용하여 실제 값과의 표준오차를 비교하였다(Clément et al., 2019; Davis et al., 1991; Sun et al., 2020).
3.1 Butterworth filter
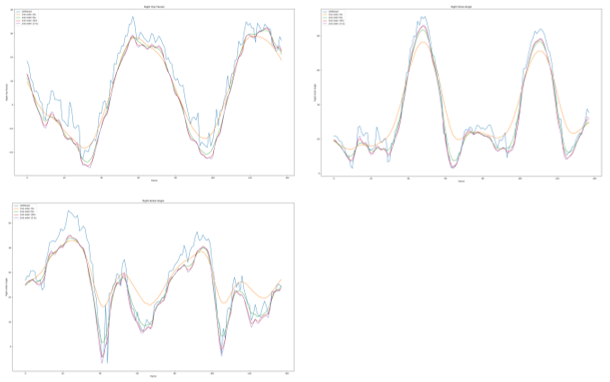
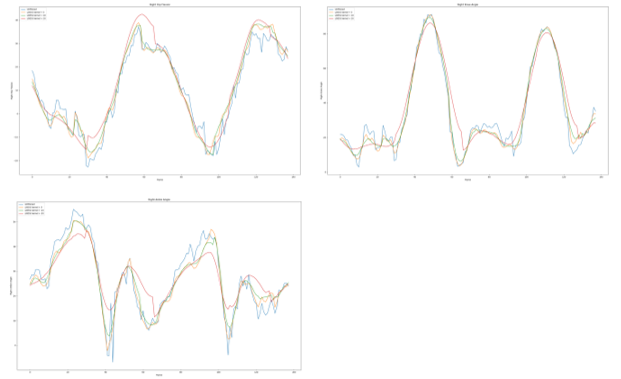
Butterworth filter는 2nd order (Figure 6)와 4th order (Figure 7)를 적용하였으며, 1Hz 이하 또는 15Hz를 초과한 차단주파수 설정 시 inverse kinematics 결과 비정상적인 움직임이 발생되어 2Hz, 5Hz, 10Hz, 15Hz를 적용하였다. 그 결과, 2nd order filter의 2Hz 차단주파수가 적용된 발목 각도를 제외한 모든 경우에서 필터를 적용하지 않은 값보다 낮은 RMSE 값이 도출된 것을 확인할 수 있었다(Table 1).
Joint |
| Subject |
| Unfiltered | 2nd order Butterworth | 4th order Butterworth | ||||||
2Hz | 5Hz | 10Hz | 15Hz | 2Hz | 5Hz | 10Hz | 15Hz | |||||
Hip joint |
| 1 | 23 | 37.14 | 29.02 | 29.02 | 32.07 | 32.39 | 31.60 | 29.01 | 32.49 | 32.63 |
2 | 27 | 45.54 | 31.57 | 31.57 | 33.71 | 33.82 | 33.54 | 32.02 | 33.83 | 33.89 | ||
3 | 19 | 18.46 | 42.12 | 42.12 | 42.58 | 43.06 | 43.12 | 42.27 | 42.51 | 43.02 | ||
| 1 | -20 | -22.73 | -18.17 | -18.17 | -25.71 | -26.53 | -20.89 | -25.19 | -26.30 | -26.92 | |
2 | -15 | -15.14 | -12.11 | -12.11 | -19.51 | -20.14 | -17.13 | -20.03 | -20.08 | -20.31 | ||
3 | -12 | -33.39 | -3.30 | -3.30 | -14.71 | -13.24 | -2.03 | -14.94 | -12.86 | -13.38 | ||
RMSE | 12.97 | 10.64 | 10.64 | 11.13 | 11.43 | 11.57 | 10.52 | 11.22 | 11.51 | |||
| Max | 1 | 78 | 91.29 | 76.41 | 83.54 | 85.59 | 86.11 | 78.30 | 85.30 | 86.38 | 86.34 |
2 | 56 | 89.81 | 74.82 | 80.00 | 82.33 | 83.43 | 76.44 | 80.48 | 82.72 | 83.99 | ||
3 | 63 | 83.85 | 81.80 | 87.39 | 88.83 | 89.04 | 82.77 | 88.96 | 88.98 | 89.11 | ||
Min | 1 | 4 | 2.92 | 13.93 | 7.36 | 3.51 | 2.79 | 11.41 | 3.82 | 2.62 | 2.42 | |
2 | 7 | 9.00 | 12.78 | 6.68 | 5.01 | 4.07 | 7.69 | 5.17 | 4.50 | 3.36 | ||
3 | 5 | 5.34 | 27.28 | 19.32 | 17.02 | 15.07 | 22.75 | 15.73 | 15.59 | 15.16 | ||
RMSE | 17.13 | 14.94 | 15.37 | 16.16 | 16.37 | 14.02 | 15.52 | 16.22 | 16.60 | |||
|
| 1 | 45 | 55.07 | 42.85 | 43.90 | 44.80 | 45.15 | 41.85 | 44.24 | 45.11 | 45.32 |
2 | 42 | 48.46 | 41.79 | 42.97 | 43.64 | 43.76 | 40.76 | 43.90 | 43.68 | 43.44 | ||
3 | 51 | 42.00 | 47.68 | 43.04 | 47.10 | 50.19 | 47.00 | 45.21 | 50.17 | 50.27 | ||
| 1 | -5 | -6.82 | 16.04 | 1.60 | -4.34 | -6.80 | 9.24 | -1.67 | -5.35 | -6.91 | |
2 | -11 | 2.32 | -1.00 | -8.09 | -10.96 | -11.96 | -7.29 | -8.97 | -11.98 | -12.74 | ||
3 | -8 | -17.26 | 21.15 | 5.75 | -2.76 | -6.78 | 14.79 | 3.98 | -4.13 | -7.91 | ||
RMSE | 9.04 | 15.32 | 7.15 | 2.76 | 1.25 | 11.28 | 5.72 | 1.81 | 1.25 | |||
Total RMSE | 13.46 | 13.80 | 11.56 | 11.44 | 11.55 | 12.35 | 11.32 | 11.44 | 11.69 | |||
Hip joint와 knee joint는 최대 및 최소 값에서 각각 12.97도와 17.13도의 오차를 보였던 원본 데이터에 비해 2Hz 이상 5Hz 이하의 낮은 차단주파수를 적용할 경우 hip joint는 10.52도(4th order, 5Hz), knee joint는 14.02도(4th order, 2Hz)까지 2~3도 가량 줄어든 오차를 도출하는 것을 확인할 수 있었다. 특히, ankle joint의 경우 9.04도의 오차를 보였던 원본 데이터 대비 10Hz와 15Hz와 같이 상대적으로 높은 차단주파수를 적용한 결과 1.25도까지 오차가 줄었으며, 이를 통해 hip joint와 knee joint 대비 ankle joint는 더욱 높은 수준의 노이즈가 발생하는 것을 확인할 수 있었다.
보행 중 성인남성의 발목은 평균적으로 plantarflexion이 약 40~55도, 그리고 본 연구 결과에서 ankle joint의 음수 값으로 확인 가능한 dorsiflexion은 10~20도를 나타낸다(Brockett and Chapman, 2016). 10Hz와 15Hz 수준의 차단주파수를 적용한 데이터는 원본 또는 2Hz와 5Hz 필터를 적용한 데이터보다 이러한 평균적인 움직임을 보이는 것을 그래프를 통해 확인할 수 있었으며, 이는 기존 문헌과도 일치하는 경향을 보였다(Robertson and Dowling, 2003). 따라서, pelvis, femur, tibia, talus 등 4가지 부위에 Butterworth filter를 적용 시, 2nd order와 4th order 필터 모두 5Hz 이상 15Hz 이하의 차단주파수를 적용하며, hip joint와 knee joint가 더욱 중요한 경우 낮은 차단주파수를, ankle joint가 중요한 경우 10Hz 이상의 높은 차단주파수를 적용할 경우 낮은 RMSE 값을 도출할 수 있다.
3.2 Gaussian filter
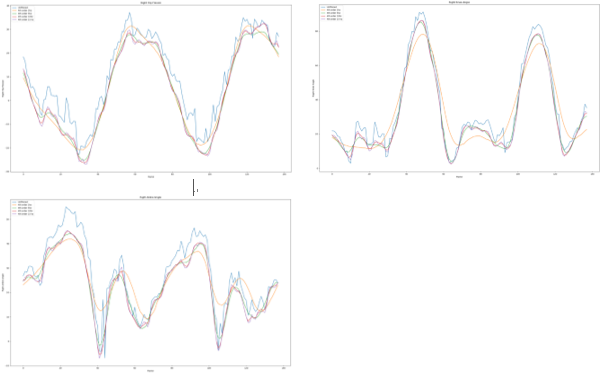
Gaussian 필터(Figure 8)의 σ 커널 값을 5 미만 또는 15 이상으로 설정 시 비정상적인 움직임이 발생되었으며, 따라서 5와 10을 적용하였다. 그 결과, 커널의 값이 10일 때 knee joint에서만 기존 데이터 대비 낮은 RMSE (15.29)가 도출되었다(Table 2). Inverse kinematics 결과 자연스러운 움직임을 보였음에도 불구하고 최대 및 최소 값에 대해 필터를 적용하지 않은 결과 대비 더 좋은 결과를 도출하지 못한 것을 확인할 수 있었으며, 이는 앞서 언급되었던 기존 데이터의 주요한 특징을 유지하려는 Gaussian 필터의 특성으로 인해 피크에서 발생하는 노이즈를 유지하며 발생하는 현상으로 볼 수 있다.
|
Joint |
Max / Min / Mean |
Subject |
Manual |
Unfiltered |
Gaussian |
|
|
5 |
10 |
|||||
|
Hip joint |
Max (flexion) |
1 |
23 |
37.14 |
40.05 |
28.12 |
|
2 |
27 |
45.54 |
42.47 |
31.58 |
||
|
3 |
19 |
18.46 |
40.37 |
40.05 |
||
|
Min (hyperextension) |
1 |
-20 |
-22.73 |
-14.12 |
-11.58 |
|
|
2 |
-15 |
-15.14 |
-10.38 |
-3.27 |
||
|
3 |
-12 |
-33.39 |
-2.13 |
8.33 |
||
|
RMSE |
12.97 |
13.78 |
13.61 |
|||
|
Knee joint |
Max |
1 |
78 |
91.29 |
84.05 |
67.56 |
|
2 |
56 |
89.81 |
83.12 |
68.51 |
||
|
3 |
63 |
83.85 |
82.92 |
73.79 |
||
|
Min |
1 |
4 |
2.92 |
13.99 |
16.70 |
|
|
2 |
7 |
9.00 |
21.88 |
21.41 |
||
|
3 |
5 |
5.34 |
26.57 |
30.54 |
||
|
RMSE |
|
|
17.13 |
18.05 |
15.29 |
|
|
Ankle joint |
Max (plantarflexion) |
1 |
45 |
55.07 |
45.64 |
42.35 |
|
2 |
42 |
48.46 |
46.23 |
40.90 |
||
|
3 |
51 |
42.00 |
47.79 |
45.21 |
||
|
Min (dorsiflexion) |
1 |
-5 |
-6.82 |
13.25 |
24.01 |
|
|
2 |
-11 |
2.32 |
7.97 |
9.66 |
||
|
3 |
-8 |
-17.26 |
17.91 |
26.73 |
||
|
RMSE |
9.04 |
15.24 |
20.48 |
|||
|
Total RMSE |
13.46 |
15.79 |
16.72 |
|||
데이터의 특성을 유지하기 때문에 움직임을 정확히 구현할 수 있지만, 관절각의 피크에서 노이즈 발생 시 모션 데이터를 활용하는 연구에서 중요한 움직임의 범위를 정확하게 관측하기 어려울 수 있으므로 기존 연구에서 Gaussian 필터를 적용하지 않은 이유를 본 연구 결과를 통해 확인할 수 있었다.
3.3 LOESS filter
LOESS 필터의 window의 값이 5 미만이거나 20 초과인 경우 비정상적인 움직임이 도출되어 제외 후 5, 10, 20에 대한 joint angle 값을 도출하였으며(Figure 9), window 값이 5인 경우에만 hip joint (12.94), knee joint (14.87), ankle joint (5.57)에서 기존 데이터(각각 12.97, 17.13, 9.04) 대비 낮은 RMSE를 확인할 수 있었다(Table 3). Window 값이 5인 경우joint angle의 최대 및 최소 값 측면에서 전반적인 RMSE는 11.82로 나타났으며, 이는 Butterworth 필터 중 가장 낮은 RMSE를 보인 5Hz 차단주파수가 적용된 4th order 필터(RMSE= 11.32)와 0.5도 차이인 것을 확인하였다. 따라서, 비선형 데이터에 대해 효과적인 결과를 보이는 LOESS 필터는 모션 데이터에 적용 시 window 값은 5 이상 10 미만의 값으로 적용한다면 낮은 RMSE 값을 기대할 수 있는 것을 결과를 통해 확인할 수 있었다.
다양한 세부적인 움직임이 발생하는 모션 데이터에서 LOESS 필터가 이러한 움직임을 노이즈로 처리할 수 있기 때문에 기존 모션 데이터 연구에서 LOESS 필터를 적극적으로 적용하지 않은 이유를 예상할 수 있다. 실제로 초당 60프레임의 영상에서는 움직임을 과도하게 smoothing하는 경향을 확인할 수 있었다. 하지만 영상의 초당 프레임이 높을 경우 LOESS 필터는 더욱 효과적일 것으로 예상할 수 있으며, 이에 대해 추후 높은 초당 프레임의 데이터에 적용하여 비교 검증 연구가 진행되어야 한다.
3.4 Median filter
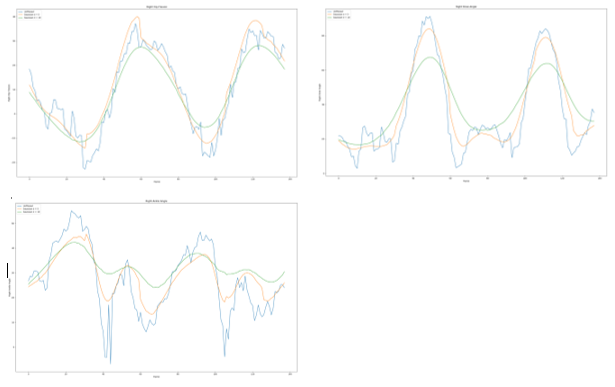
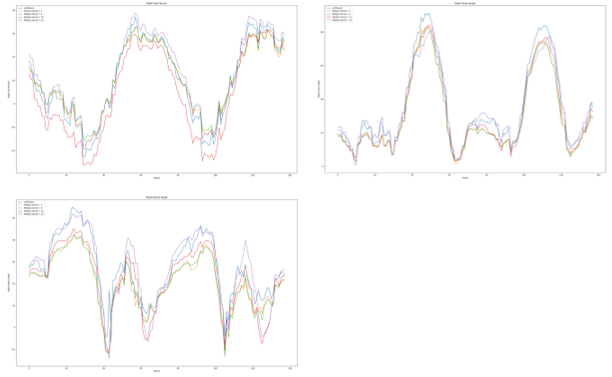
Median 필터 적용 결과 모든 window 크기(k=5, 9, 15, 25)에서 적용한 4종의 필터 중 가장 낮은 RMSE 값(9.53, 9.33, 11.01, 11.27)이 도출되었다(Table 4). 설정한 window 크기에 따라 hip joint의 경우 최대 8.68도, knee joint는 12.26도, ankle joint는 5.04도의 오차를 보였으며 따라서 joint angle의 최대 및 최소 값을 측정하는 경우 간헐적 노이즈를 효과적으로 제거하는 median 필터를 적용하는 것이 적절해 보일 수 있다.
Joint | Max / Min / | Subject |
| Unfiltered | Median | |||
5 | 9 | 15 | 25 | |||||
Hip joint |
| 1 | 23 | 37.14 | 32.79 | 32.96 | 31.86 | 38.81 |
2 | 27 | 45.54 | 32.51 | 32.66 | 35.60 | 47.96 | ||
3 | 19 | 18.46 | 34.75 | 34.20 | 42.62 | 35.43 | ||
| 1 | -20 | -22.73 | -18.23 | -15.70 | -26.30 | -19.69 | |
2 | -15 | -15.14 | -11.45 | -9.91 | -20.16 | -10.67 | ||
3 | -12 | -33.39 | -19.90 | -20.01 | -14.65 | -13.68 | ||
RMSE |
|
| 12.97 | 8.68 | 8.86 | 11.43 | 12.78 | |
Knee joint | Max | 1 | 78 | 91.29 | 83.44 | 82.66 | 84.16 | 81.76 |
2 | 56 | 89.81 | 77.40 | 76.59 | 80.13 | 80.84 | ||
3 | 63 | 83.85 | 85.00 | 83.71 | 86.30 | 79.80 | ||
Min | 1 | 4 | 2.92 | 1.79 | 3.27 | 2.69 | 0.75 | |
2 | 7 | 9.00 | 2.03 | 1.81 | 3.02 | 13.06 | ||
3 | 5 | 5.34 | 5.42 | 5.43 | 13.12 | 9.27 | ||
RMSE |
|
| 17.13 | 12.92 | 12.26 | 14.41 | 12.77 | |
Ankle joint |
| 1 | 45 | 55.07 | 42.99 | 42.23 | 45.20 | 51.86 |
2 | 42 | 48.46 | 39.37 | 39.13 | 44.50 | 48.05 | ||
3 | 51 | 42.00 | 44.09 | 44.17 | 48.72 | 43.35 | ||
| 1 | -5 | -6.82 | -12.79 | -13.27 | -11.71 | -14.15 | |
2 | -11 | 2.32 | -16.60 | -16.53 | -19.74 | -4.51 | ||
3 | -8 | -17.26 | -13.59 | -13.52 | -12.43 | -15.63 | ||
RMSE |
|
| 9.04 | 5.51 | 5.66 | 5.04 | 7.37 | |
Total RMSE | 13.46 | 9.53 | 9.33 | 11.01 | 11.27 | |||
하지만, 낮은 화질의 카메라와 사람의 옷과 체형에 의해 골격인식에 영향을 받는 Openpose의 특성으로 인해 기존의 데이터에는 이상치와 같은 노이즈 뿐만 아니라 지속적인 노이즈 또한 발생하였으며, 이러한 지속적인 노이즈를 제거하지 못하는 median 필터의 특성으로 인해 비교한 3가지 필터를 통해 도출된 부드러운 움직임과 달리 노이즈가 있는 움직임이 도출되었다(Figure 10). 따라서, 최대 및 최소 값에 대해 낮은 RMSE를 보였음에도 보행분석 시 median 필터를 단독으로 사용하는 것은 적절하지 않은 것으로 볼 수 있으며, 이상치 제거를 위한 median 필터와 추가적으로 지속적인 데이터의 노이즈를 제거하는 Butterworth 필터 등 두 가지 이상의 필터를 적용하여 자세 예측 데이터의 정확도를 높이기 위한 추후 연구가 진행되어야 한다.
본 연구를 통해 Openpose를 활용한 웹캠 기반의 3D 보행분석 시스템을 구축하였으며, 도출된 신체 좌표 데이터에 Butterworth, Gaussian, LOESS, Median 필터 등 parameter 값을 다르게 조정한 4가지 필터를 적용하여 보행분석 시 핵심이 되는 hip, knee, ankle joint의 각도 값을 비교하였다.
그 결과, Butterworth 필터의 차단주파수는 5~15Hz, Gaussian 필터의 σ 커널은 5, LOESS의 window 값은 5 수준으로 설정할 때 자연스러운 움직임과 동시에 필터를 적용하지 않은 값에 비해 낮은 RMSE 값을 도출할 수 있었다. 반면, Median 필터는 window 값이 9일 때 모든 필터 중 가장 낮은 RMSE 값을 보였지만 지속적인 노이즈를 제거하지 못하는 Median 필터의 특성으로 인해 자연스러운 움직임은 도출하지 못했다. 따라서, 본 연구를 통해 확인한 Median 필터의 뛰어난 이상치 제거 성능을 활용함과 동시에 지속적인 노이즈를 제거할 수 있는 추가적인 필터를 2중으로 적용하여 비교하는 추가적인 연구가 진행된다면 저비용으로 3D 동작분석 정확도를 향상시켜 다양한 분야에서 활용할 수 있을 것으로 기대한다.
References
1. Brockett, C.L. and Chapman, G.J., Biomechanics of the ankle. Orthopaedics and Trauma, 30(3), 232-238, 2016. https://doi.org/ 10.1016/j.mporth.2016.04.015
Google Scholar
2. Butterworth, S., On the theory of filter amplifiers. Wireless Engineer, 7(6), 536-541, 1930.
Google Scholar
3. Cao, Z., Simon, T., Wei, S.E. and Sheikh, Y., Realtime Multi-person 2D Pose Estimation Using Part Affinity Fields. 2017 IEEE Conference on Computer Vision and Pattern Recognition (CVPR), 1302-1310, 2017. https://doi.org/10.1109/CVPR.2017.143
Google Scholar
4. Chen, J., Jönsson, P., Tamura, M., Gu, Z., Matsushita, B. and Eklundh, L., A simple method for reconstructing a high-quality NDVI time-series data set based on the Savitzky-Golay filter. Remote Sensing of Environment, 91(3-4), 332-344, 2004. https://doi.org/ 10.1016/j.rse.2004.03.014
Google Scholar
5. Clément, J., Blakeney, W., Hagemeister, N., Desmeules, F., Mezghani, N., Lowry, V. and Vendittoli, P.A., Hip-Knee-Ankle (HKA) angle modification during gait in healthy subjects. Gait & Posture, 72, 62-68, 2019. https://doi.org/10.1016/j.gaitpost.2019.05.025
6. Cleveland, W.S. and Devlin, S.J., Locally Weighted Regression: An Approach to Regression Analysis by Local Fitting. Journal of the American Statistical Association, 83(403), 596-610, 1988. https://doi.org/10.1080/01621459.1988.10478639
Google Scholar
7. D'Antonio, E., Taborri, J., Mileti, I., Rossi, S. and Patane, F., Validation of a 3D Markerless System for Gait Analysis Based on OpenPose and Two RGB Webcams. IEEE Sensors Journal, 21(15), 17064-17075, 2021. https://doi.org/10.1109/JSEN.2021.3081188
Google Scholar
8. Davis, R.B., Õunpuu, S., Tyburski, D. and Gage, J.R., A gait analysis data collection and reduction technique. Human Movement Science, 10(5), 575-587, 1991. https://doi.org/10.1016/0167-9457(91)90046-Z
Google Scholar
9. De La Escalera, A. and Armingol, J.M., Automatic Chessboard Detection for Intrinsic and Extrinsic Camera Parameter Calibration. Sensors, 10(3), 2027-2044, 2010. https://doi.org/10.3390/s100302027
Google Scholar
10. Delp, S.L., Anderson, F.C., Arnold, A.S., Loan, P., Habib, A., John, C.T., Guendelman, E. and Thelen, D.G., OpenSim: Open-Source Software to Create and Analyze Dynamic Simulations of Movement. IEEE Transactions on Biomedical Engineering, 54(11), 1940-1950, 2007. https://doi.org/10.1109/TBME.2007.901024
Google Scholar
11. Ekanayake, S.W., Morris, A.J., Forrester, M. and Pathirana, P.N., BioKin: An ambulatory platform for gait kinematic and feature assessment. Healthcare Technology Letters, 2(1), 40-45, 2015. https://doi.org/10.1049/htl.2014.0094
Google Scholar
12. Hidalgo, G., Raaj, Y., Idrees, H., Xiang, D., Joo, H., Simon, T. and Sheikh, Y., Single-network whole-body pose estimation. Proceedings of the IEEE/CVF International Conference on Computer Vision, 6982-6991, 2019.
Google Scholar
13. Hwang, H. and Haddad, R.A., Adaptive median filters: New algorithms and results. IEEE Transactions on Image Processing, 4(4), 499-502, 1995. https://doi.org/10.1109/83.370679
Google Scholar
14. Justusson, B.I., Median Filtering: Statistical Properties. In Two-Dimensional Digital Signal Prcessing II (Vol. 43, pp. 161-196). Springer-Verlag, 1981. https://doi.org/10.1007/BFb0057597
Google Scholar
15. Karvekar, S., Abdollahi, M. and Rashedi, E., Smartphone-based human fatigue level detection using machine learning approaches. Ergonomics, 64(5), 600-612, 2021. https://doi.org/10.1080/00140139.2020.1858185
Google Scholar
16. Kim, W., Sung, J., Saakes, D., Huang, C. and Xiong, S., Ergonomic postural assessment using a new open-source human pose estimation technology (OpenPose). International Journal of Industrial Ergonomics, 84, 103164, 2021. https://doi.org/10.1016/ j.ergon.2021.103164
Google Scholar
17. Lin, C.B., Dong, Z., Kuan, W.K. and Huang, Y.F., A Framework for Fall Detection Based on OpenPose Skeleton and LSTM/GRU Models. Applied Sciences, 11(1), 329, 2020. https://doi.org/10.3390/app11010329
Google Scholar
18. Liu, P.L. and Chang, C.C., Simple method integrating OpenPose and RGB-D camera for identifying 3D body landmark locations in various postures. International Journal of Industrial Ergonomics, 91, 103354, 2022. https://doi.org/10.1016/j.ergon.2022.103354
Google Scholar
19. Mahata, S., Saha, S.K., Kar, R. and Mandal, D., Optimal design of fractional order low pass Butterworth filter with accurate magnitude response. Digital Signal Processing, 72, 96-114, 2018. https://doi.org/10.1016/j.dsp.2017.10.001
Google Scholar
20. Robertson, D.G.E. and Dowling, J.J., Design and responses of Butterworth and critically damped digital filters. Journal of Electromyography and Kinesiology, 13(6), 569-573, 2003. https://doi.org/10.1016/S1050-6411(03)00080-4
Google Scholar
21. Rouhandeh, A., Joslin, C., Qu Z., and Ono Y., Non-invasive assessment of soft-tissue artefacts in hip joint kinematics using motion capture data and ultrasound depth measurements. 2014 36th Annual International Conference of the IEEE Engineering in Medicine and Biology Society, 4342-4345, 2014. https://doi.org/10.1109/EMBC.2014.6944585
Google Scholar
22. Sabatini, A.M., Martelloni, C., Scapellato, S. and Cavallo, F., Assessment of Walking Features From Foot Inertial Sensing. IEEE Transactions on Biomedical Engineering, 52(3), 486-494, 2005. https://doi.org/10.1109/TBME.2004.840727
Google Scholar
23. Salarian, A., Russmann, H., Vingerhoets, F.J.G., Dehollain, C., Blanc, Y., Burkhard, P.R. and Aminian, K., Gait Assessment in Parkinson's Disease: Toward an Ambulatory System for Long-Term Monitoring. IEEE Transactions on Biomedical Engineering, 51(8), 1434-1443, 2004. https://doi.org/10.1109/TBME.2004.827933
Google Scholar
24. Schepers, H.M., Koopman, H.F.J.M. and Veltink, P.H., Ambulatory Assessment of Ankle and Foot Dynamics. IEEE Transactions on Biomedical Engineering, 54(5), 895-902, 2007. https://doi.org/10.1109/TBME.2006.889769
Google Scholar
25. Seel, T., Raisch, J. and Schauer, T., IMU-Based Joint Angle Measurement for Gait Analysis. Sensors, 14(4), 6891-6909, 2014. https:// doi.org/10.3390/s140406891
Google Scholar
26. Sun, M., Zhang, Y., Peng, Y., Fu, D., Fan, H. and He, R., Gait Analysis after Total Knee Arthroplasty Assisted by 3D-Printed Personalized Guide. BioMed Research International, 2020, 1-9, 2020. https://doi.org/10.1155/2020/6485178
Google Scholar
27. Tsai, T.H. and Hsu, C.W., Implementation of Fall Detection System Based on 3D Skeleton for Deep Learning Technique. IEEE Access, 7, 153049-153059, 2019. https://doi.org/10.1109/ACCESS.2019.2947518
Google Scholar
28. Yan, Y., Yang, P., Yan, L., Wan, J., Sun, Y. and Tansey, K., Automatic checkerboard detection for camera calibration using self-correlation. Journal of Electronic Imaging, 27(03), 1, 2018. https://doi.org/10.1117/1.JEI.27.3.033014
Google Scholar
29. Young, I.T. and Van Vliet, L.J., Recursive implementation of the Gaussian filter. Signal Processing, 44(2), 139-151, 1995.
Google Scholar
30. Yu, Y., Li, H., Yang, X., Kong, L., Luo, X. and Wong, A.Y.L., An automatic and non-invasive physical fatigue assessment method for construction workers. Automation in Construction, 103, 1-12, 2019. https://doi.org/10.1016/j.autcon.2019.02.020
Google Scholar
PIDS App ServiceClick here!