eISSN: 2093-8462 http://jesk.or.kr
Open Access, Peer-reviewed
eISSN: 2093-8462 http://jesk.or.kr
Open Access, Peer-reviewed
JuYoun Kwon
, Ken Parsons
10.5143/JESK.2017.36.1.23 Epub 2017 March 02
Abstract
Objective: This paper presents a study to evaluate the WBGT index for assessing the effects of a wide range of outdoor weather conditions on human responses.
Background: The Wet Bulb Globe Temperature (WBGT) index was firstly developed for the assessment of hot outdoor conditions. It is a recognised index that is used world-wide. It may be useful over a range of outdoor conditions and not just for hot climates.
Method: Four group experiments, involving people performing a light stepping activity, were conducted to determine human responses to outside conditions in the U.K. They were conducted in September 2007 (autumn), December 2007 (winter), March 2008 (spring) and June 2008 (summer). Environmental measurements included WBGT, air temperature, radiant temperature (including solar load), humidity and wind speed all measured at 1.2m above the ground, as well as weather data measured by a standard weather station at 3m to 4m above the ground. Participants' physiological and subjective responses were measured. When the overall results of the four seasons are considered, WBGT provided a strong prediction of physiological responses as well as subjective responses if aural temperature, heart rate and sweat production were measured.
Results: WBGT is appropriate to predict thermal strain on a large group of ordinary people in moderate conditions. Consideration should be given to include the WBGT index in warning systems for a wide range of weather conditions. However, the WBGT overestimated physiological responses of subjects. In addition, tenfold Borg's RPE was significantly different with heart rate measured for the four conditions except autumn (p<0.05). Physiological and subjective responses over 60 minutes consistently showed a similar tendency in the relationships with the WBGThead and WBGTabdomen.
Conclusion: It was found that either WBGThead or WBGTabdomen could be measured if a measurement should be conducted at only one height. The relationship between the WBGT values and weather station data was also investigated. There was a significant relationship between WBGT values at the position of a person and weather station data. For UK daytime weather conditions ranging from an average air temperature of 6°C to 21℃ with mean radiant temperatures of up to 57℃, the WBGT index could be used as a simple thermal index to indicate the effects of weather on people.
Application: The result of evaluation of WBGT might help to develop the smart clothing for workers in industrial sites and improve the work environment in terms of considering workers' wellness.
Keywords
WBGT Clothing Weather effect Heat stress Human responses Sweat rate Thermal sensation Comfort
Exposure to extreme environments causes many risks for human health. Hot and humid outdoor conditions with solar radiation threaten the health of people who perform outdoor activities especially those involving high work intensity. A thermal index provides a single value that is representative of how a number of factors in combination (such as air temperature, radiant temperature, humidity, and wind) affect a person. For a valid and sensitive index, the combined effects of the environment on a person vary, and the index value will vary. Many thermal indices have been developed over the years, but most are restricted to specific conditions (heat stress, thermal comfort, cold stress). There is a need to identify a thermal index that can be used to quantify the effects of outdoor conditions on people. If such an index can be identified, it could be used to interpret weather data in terms of likely effects on peoples' health and safety, comfort and productivity. It could also allow early warning of the effects of extreme weather such as heat waves and prolonged cold weather. The Wet Bulb Globe Temperature (WBGT) index was firstly developed for the assessment of hot outdoor conditions. It is a recognised index that is used world-wide (Kwon et al., 2015). In principle it may be useful over a range of outdoor conditions and not just for hot climates. This paper presents a study to evaluate the use of the WBGT index in outdoor conditions found in the United Kingdom.
In hot environments a simple method based upon the wet bulb globe temperature (WBGT) index provides for monitoring and regulating heat stress (ISO 7243, 1989). This index was originally developed by Yaglou and Minard (1957) to reduce heat casualties during the outdoor training of military recruits in the United States (USA). WBGT limit values were used to indicate when military recruits could train. The use of the WBGT index (instead of only air temperature) to determine safe conditions, led to a decrease in the number of heat casualties and time lost by moratoriums on training in the heat. The WBGT index was adapted by the American Conference of Governmental Industrial Hygienists (ACGIH) and is now accepted and established as international standard ISO 7243. This index is also convenient to use in industrial environments as it provides a trade-off between uncomplicated measurement of the thermal environment and the accuracy of the index (ISO 7243, 1989). WBGT is influenced by radiation from hot and cold surfaces and the sun, air temperature, humidity and wind speed. It is expressed with the measurement of natural wet-bulb temperature (tnwb), globe temperature (tg) and dry bulb temperature (ta). The wet bulb globe temperature (WBGT) is calculated from the combination of natural wet bulb temperature, globe temperature and air temperature either in the sunlight or no sunlight.
If people are exposed to a heterogeneous thermal environment, the WBGT index should be determined at three heights above the ground; at the head, the abdomen and the ankles (i.e. 0.1m, 1.1m and 1.7m for standing persons and 0.1m, 0.6m and 1.1m for seated persons). If the thermal environment is homogeneous, the WBGT index can be measured at only abdomen level. The mean value of the WBGT index for heterogeneous conditions is calculated through the following equation:
The formula applies to the evaluation of the mean effect of heat on man during a period representative of his activity. The method provided in ISO 7243 (1989) involves the measurement of the WBGT and ISO 7243 provides the WBGT reference values depending on activity levels. The value is then compared with WBGT reference values which indicate limits above which the environment may cause a risk to health.
The WBGT index can evaluate heat stress on the human body during a certain period of activity. If the WBGT reference values are exceeded, more elaborate assessment methods may be required. The reference values apply for people wearing light clothing.
Several studies have pointed out the limitations of the WBGT index. To find the single value of the WBGT index, natural wet-bulb temperature, dry bulb temperature, and globe temperature are required: the composite of these varying environmental parameters may result in the same WBGT value. This is the nature of a thermal index however and the index value will indicate where different combinations would have equivalent effect. Azer and Hsu (1977) pointed out that WBGT is less sensitive at a wind speed of above 1.5m/s and that WBGT became less sensitive when air temperature and relative humidity went up. Nash (2004) noted that WBGT should consider the time period for time-weighting the average of the metabolic demands and the mean of the WBGT. Budd (2008) stated that the index underestimated heat stress in an environment with high humidity or low wind speed and sweat was evaporated inactively at those conditions. Rastogi et al. (1992) suggested that the WBGT index could not presuppose physiological strain in a severe thermal stress environment. Parsons (2006) pointed out that interpretation of the WBGT index might be influenced by estimates of metabolic rate which varies with activity, circumstance of measurement and individual differences such as gender, race and human behaviour from culture differences.
The measurements of natural wet-bulb temperature (tnwb), globe temperature (tg), and air temperature (ta) are needed for the evaluation of heat stress with WBGT index. Whether the heat stress should be reduced or not can be decided by comparing the collected data with the reference values (ISO 7243, 1989). This comparison is relatively easy and simple, and the WBGT index may be used in four season including cold as well as hot thermal environments. However, the usability of WBGT often becomes a controversial issue. The measurement of WBGT relies on just the natural wet-bulb temperature and the globe temperature so that any error of instrument or measurements may greatly influence the interpretation of WBGT. In outdoor weather the diversity of conditions such as cloud cover and a sudden change of weather and the way of dealing with the WBGT would affect the result and the interpretation (Holmér, 2010; Kwon, 2009; Parsons, 2006).
The aim of this paper was to evaluate the WBGT index for assessing the effects of outdoor weather conditions on physiological and subjective responses of people in the U.K. A secondary aim was to consider the relationship between WBGT values measured at the level of people on the ground and weather station data gathered by a standard weather station.
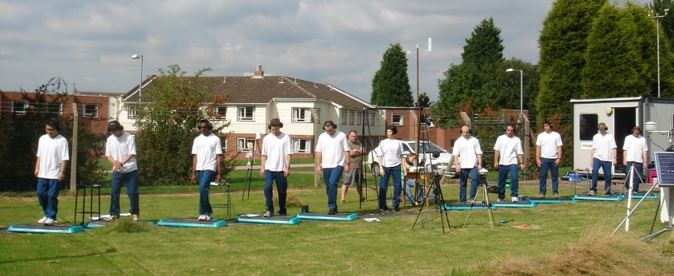
Four group experiments were conducted in each season over a year between September, 2007 and June, 2008 in Loughborough, the U.K (Figure 1). MetOffice does exist not in Loughborough but in Sutton Bonington (Latitude=52.84N: Longitude=01.25W; approximately 8km far from Loughborough). Mean maximum air temperature for September, December, March and June in 2008 were 17.9℃, 6.5℃, 10.5℃ and 19.1℃ respectively. Mean relative humidity for the four months were 87%, 90%, 75%, and 80% respectively and mean wind speed were 2.8m/s, 3.3m/s, 6.1m/s, and 3.2m/s respectively. An experiment for autumn (September) was conducted on the 6th of September, 2007 between 1pm and 2pm and an experiment for winter (December) was conducted on the 12th of December, 2007 between 11.30am and 2pm. An experiment for spring (March) was conducted on the 11th of March, 2008 and an experiment for summer (June) was conducted on the 10th of June, 2008 between 1pm and 3pm. For each experiment people carried out light stepping activity positioned below a weather station. As well as weather station data gathered at 3m to 4m, WBGT values were measured at the level of the participants. Subjective and physiological responses were also recorded. The study was confirmed as acceptable by the Loughborough University Ethical Advisory Committee. All participants signed the informed consent form after being instructed in the experiment procedures as well as the aim of the experiment.
2.1 Participants
This study involved a total of 38 men aged 18 to 49 years and only eight participants took part in the experiment of December (Table 1). All subjects were healthy and included students and professional workers.
|
Subject |
Age (yrs) |
Height (m) |
Weight (Kg) |
BSA* (m2) |
|
September (n=10) |
26 (3.37) |
1.78 (0.047) |
74.7 (8.55) |
1.92 (0.115) |
|
December (n=8) |
21 (0.99) |
1.79 (0.030) |
72.1 (3.95) |
1.90 (0.050) |
|
March (n=10) |
24 (2.57) |
1.78 (0.076) |
75.3 (6.28) |
1.93 (0.114) |
|
June (n=10) |
27 (10.04) |
1.72 (0.070) |
68.4 (8.48) |
1.80 (0.110) |
|
Total (n=38) |
24.5 (4.24) |
1.77 (0.056) |
72.6 (6.82) |
1.89 (0.098) |
2.2 Measurement of weather
All parameters were recorded every 15 minutes over a year. Data was collected from October 2007 till September 2008 and the data were selected on separate four days. The site of the weather station is away from buildings and roads on Loughborough university campus, surrounded by a secure wire fence. The size of the meteorological station is 25m×20m. The air temperature and relative humidity were measured using a HMP45C TEMP&RH probe (Campbell scientific, Inc.) located at a height of three meters above the ground. The wind speed was measured using a CSAT3 three dimensional sonic anemometer (Campbell scientific, Inc.) located four meters above the ground. Solar radiation was measured using a CNR1 net radiometer (Campbell scientific, Inc.) located three meters above the ground.
2.3 Environmental measurement
Environmental conditions were recorded near subjects every minute. Air temperature and relative humidity were measured using a whirling hygrometer. Dry and wet bulb temperatures (Grant CT-U-V3-1 probe, U.K.) were measured using shielded thermistors and black globe temperature with a diameter of 0.15m which a thermistor (a grant type EU, U.K.) was at the centre of the globe was measured at the same place as the dry and wet bulb temperatures were measured in the sunlight at the three heights of 0.2m, 1.2m and 1.7m. Radiation levels were measured using a pyranometer (Kipp and Zonen CM11, Holland). Wind speed was measured using an anemometer (Brüel & Kjær MM 0038, Denmark) and a weather station (Oregon WMR 928 NX, USA) at 1.2m above the ground. Clothing worn varied with weather conditions: three types of ensembles were selected depending on basic air temperature as well as wind, cloud cover and the sun (Table 2). The clothing insulation of each ensemble was measured before the study in a climate chamber using a thermal manikin (Victoria, Espergerde, Denmark). The thermal conditions of the climatic chamber when measuring the clothing insulation were air temperature of 21.2(±0.23)℃, relative humidity of 45(±5)%, and wind speed of 0.15(±0.05)ms-1.
The wet bulb globe temperature (WBGT) is calculated from the following equations:
Where
= temperature of a natural wet bulb thermometer (℃)
= temperature of a 150mm diameter black globe thermometer (℃)
= air temperature (℃).
The weather station's instrumentation was mounted after the first group experiment during September was conducted.
|
|
Type 1 (0.59clo+) |
Type 2 (1.07clo) |
Type 3 (1.13clo) |
|
Underwear |
* |
* |
* |
|
White short-sleeved T-shirt |
* |
|
* |
|
White long-sleeved shirt |
|
* |
* |
|
Grey sweat shirt |
|
* |
* |
|
Blue jeans |
* |
* |
* |
|
Socks |
* |
* |
* |
|
Training shoes |
* |
* |
* |
2.4 Physiological measurement
Subjects wore aural thermistors in one side of ears that were insulated from the influence of outside conditions. Cotton wool and plastic ear plugs were used for providing good insulation. Aural temperature was measured every minute during each 60 minute exposure using thermistors connected to a data logger (Grant SQ1000, Cambridge, UK). Subjects' body weights were measured just before and after each experiment session. Each subject was weighed minimally clothed before and after the exposure using a Multi-range Digital Dynamic Scale (Mettler 1D1, Mettler Toledo, USA). The amount of sweat was found using the difference between subjects' semi-nude weights before and after the experiments. Sweat evaporated was determined by taking sweat trapped in clothing from total mass loss from the body (Parsons, 2003). Heart rate monitor (Polar Electro, Kempele, Finland) was used for measuring heart rate every minute. Metabolic rate was estimated and was adjusted by based on individuals' body weight and body surface area.
2.5 Subjective measurement
A subjective questionnaire was answered by the subjects every ten minutes for September and December throughout during each 60 minute exposure using an ISO 11-point thermal sensation scale (ISO 10551, 2001) but the interval was shorter as every five minutes for Groups C and D because outdoor weather conditions were much fluctuated. Subjects gave ratings of thermal sensation (extremely cold (-5), very cold (-4), cold (-3), cool (-2), slightly cool (-1), neutral (0), slightly warm (1), warm (2), hot (3), very hot (4), and extremely hot (5)), comfort (not uncomfortable (1), slightly uncomfortable (2), uncomfortable (3), and very uncomfortable (4)), preference (much cooler (-3), cooler (-2), slightly cooler (-1), no change (0), slightly warmer (1), warmer (2), and much warmer (3)), pleasantness(very unpleasant (-3), unpleasant (-2), slightly unpleasant (-1), neither pleasant nor unpleasant (0), slightly pleasant (1), pleasant (2), and very pleasant (3)) and Borg's rate of perceived exertion (Borg's RPE).
2.6 Procedures
When participants arrived at the experiment place (the Loughborough University weather station compound), the details of the experiments were informed. Aural thermistors and polar testers were fitted. The weights of subjects' semi-nude and fully clothed bodies were measured. The participants exercised for an hour, performing a step test in time to a metronome set at a rate of 20 steps per minute on 100mm high step (ACSM, 2009; ISO 8996, 2004). Each minute, the subjects' physiological responses and the environmental parameters were measured. A subjective response was measured every ten minutes (every five minutes for March and June). At the end of the experiment, subjects' semi-nude and clothed weights were recorded. Participants in September all started at the same time but participants in December, March and June started at different times with approximately five minutes intervals between participants. This avoided queuing and allowed measurements of body weight just before and after each 60 minute exposure.
2.7 Data analysis
One way ANOVA were used on physiological parameters to investigate differences between participants for September and December. Environmental conditions for December and March were slightly different among participants, and the analysis was not used. The difference between Borg's RPE & heart rate was found out using Mann-Whitney U test. Pearson correlation coefficients were calculated to find correlations between weather parameters, the environment and physiological responses and WBGT among all 38 participants of the four groups. Spearman rho correlations were used to investigate the relationships between subjective responses and the WBGT among all 38 participants of the four groups. Sweat evaporated was correlated with average WBGT over 60 minutes. A single value of clothing insulation was applied to an experiment in 60 minutes. The correlation between the WBGTs and environmental conditions determined from weather station data was therefore analysed using the results for December, March and June. Regression models were produced through linear regression analyses using SPSS 12.0.
3.1 Environmental measurementsts
The environmental conditions measured at a height of 1.2m for each group experiment are shown in Table 3. Standard deviation for September was the biggest and one for December was the smallest literally. However, the averaged value of solar radiation for December was the lowest as 123Wm-2 and the value of solar radiation for June was the largest as 876Wm-2. Therefore, the standard deviation for December was relatively large. The range of environmental conditions was wide, and three types of ensembles were used (Table 2). Holmér (2010) also pointed out that weather data and WBGT have the accuracy of the relationship.
|
Group |
Measured height |
September |
December |
March |
June |
|
Ta (℃) |
at 3m height |
. |
5.7 (0.48) |
12.1 (0.96) |
20.3 (0.22) |
|
ø (%) |
. |
69 (1.4) |
70 (3.1) |
52 (3.9) |
|
|
SR (Wm-2) |
. |
114 (26.9) |
485 (79.6) |
821 (27.8) |
|
|
V (ms-1) |
. |
0.85 (0.160) |
2.66 (0.676) |
1.83 (0.090) |
|
|
Air temperature ta
(℃) |
at 1.2m height |
24.7 (1.12) |
6.7 (0.41) |
13.7 (0.14) |
20.8 (0.12) |
|
Mean radiant temperature tr
(℃) |
49.5 (8.30) |
17.9 (5.18) |
44.2 (3.64) |
56.6 (0.27) |
|
|
Wind speed v (ms-1) |
0.8 (0.39) |
1.1 (0.19) |
2.4 (0.11) |
1.6 (0.05) |
|
|
Relative humidity ø (%) |
61 (5.16) |
69 (1.69) |
65 (2.04) |
54 (0.49) |
|
|
Solar radiation (Wm-2) |
446 (169.1) |
123 (15.1) |
434 (49.9) |
876 (19.5) |
|
|
WBGT (℃) |
24.0 (1.07) |
5.6 (1.02) |
13.0 (0.69) |
20.6 (0.47) |
|
|
WBGThead (℃) |
23.5 (0.90) |
5.8 (1.15) |
12.5 (0.5) |
19.7 (0.31) |
|
|
WBGTabdomen (℃) |
24.0 (1.13) |
5.5 (0.91) |
13.1 (0.65) |
20 (0.29) |
|
|
WBGTankles (℃) |
24.4 (1.14) |
5.5 (0.92) |
13.3 (0.69) |
22 (0.32) |
|
|
Clothing (clo*) |
0.59 |
1.13 |
1.07 |
0.59 |
|
|
Metabolic rate (Wm-2) |
163 (9.4) |
159 (5.4) |
164 (6.6) |
159 (11.2) |
3.2 Physiological measurements
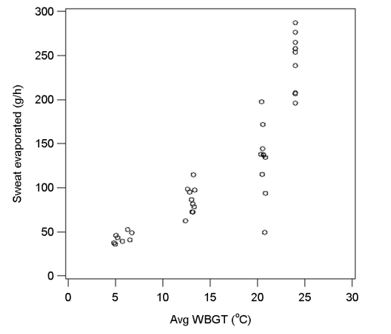
The physiological responses were various among groups. Especially, sweat production was largely diverse among groups. The mean value (SD) of sweat evaporated was 245(31.5)gm-2h-1 for September, 43(5.8)gm-2h-1 for December, 86(15.6)gm-2h-1 for March, and 132(40.4)gm-2h-1 for June (Figure 2). Therefore, evaporative sweat losses were 4.1gm-2min-1 for September, 0.7gm-2min-1 for December, 1.4gm-2min-1 for March, and 2.3gm-2min-1 for June. U.K.weather is relatively moderate over a year and the averaged maximum air temperature of Sutton Bonington in 2008 was just 1.2℃ different between June and September. Furthermore, there are hot days in autumn so called an Indian summer. The current study showed that air temperature in September was higher than one in summer. It made sweat rates and aural temperatures in September higher.
Aural temperature increased as time passed and the averaged end value (SD) of aural temperature was 37.1(0.34) ℃ for September, 36.1(0.41) ℃ for December, 36.1(0.81) ℃ for March, and 36.6(0.59) ℃ for June. However, heart rate barely fluctuated for 60 minutes. The average heart rate (SD) of September in 60 minutes was 106(15.8) beats/minute, 91(11.6) beats/minute for December, 101(17.2) beats/minute for March, and 91(9.2) beats/minute for June. ACSM suggested that interaction among psychological and physical factors affects perceived exertion, and it might influence on current study generally showed lower values. Furthermore, metabolic rate can be estimated by a step test which was used in the present study. Although ACSM supports both Borg's RPE and the predicting method from a step test, both of them revealed inaccuracy. Heart rate was overestimated by Borg's RPE but underestimated by a step test.
3.3 Subjective measurements
The averaged values of subjective responses over 60 minutes are shown in Table 4. The thermal sensation for September and June showed higher than 'slightly warm' but the value of December and March showed lower than 'slightly warm'. Thermal comfort was 'slightly uncomfortable' for all four groups. Participants wanted to improve the thermal environment; participants of September, March and June would like to be slightly cooler but participants of December wanted to be slightly warmer (Table 4). Participants' pleasantness for December, March, and June felt more positive than 'neither pleasant nor unpleasant'. Kwon and Choi (2012) found that sedentary Korean women could feel comfort with 1clo when air temperature was 27℃. The current study about subjective responses, for example in September, could be more positive than current results. In addition, Kwon et al. (2015) showed that elderly farmers put on 0.66clo (including shoes, hats, and accessories) on their own initiative while they worked in the metabolic rate ranging 165Wm-2 to 185Wm-2 at WBGT of 26℃, and they tended to wear more clothing which can affect subjective responses. The averaged value of Borg's RPE for September, December, March, and June was 10.3, 7.6, 8.8, and 8.3 respectively, and participants felt from extremely light to less than light for the stepping test. If heart rate was estimated from Borg's RPE which is multiplied by 10, there was significant difference between heart rate and Borg's RPE for all conditions except September (p<0.05). Therefore, December, March, and June was lower than heart rate measured and Borg's RPE for September was considered as the same actual heart rate.
|
|
Sensation |
Comfort |
Preference |
Pleasantness |
Borg's RPE |
|
September |
2.0 (0.83) |
2.1 (0.72) |
-1.2 (0.63) |
-0.7 (0.97) |
10.3 (2.56) |
|
December |
0.2 (1.14) |
1.5 (0.52) |
0.5 (0.72) |
0.2 (0.52) |
7.6 (1.37) |
|
March |
0.9 (1.04) |
1.4 (0.68) |
-0.5 (0.73) |
0.1 (0.99) |
8.8 (2.31) |
|
June |
1.6 (0.98) |
1.7 (0.63) |
-0.6 (0.84) |
0 (1.24) |
8.3 (1.92) |
3.4 Environmental conditions from weather station vs WBGTs
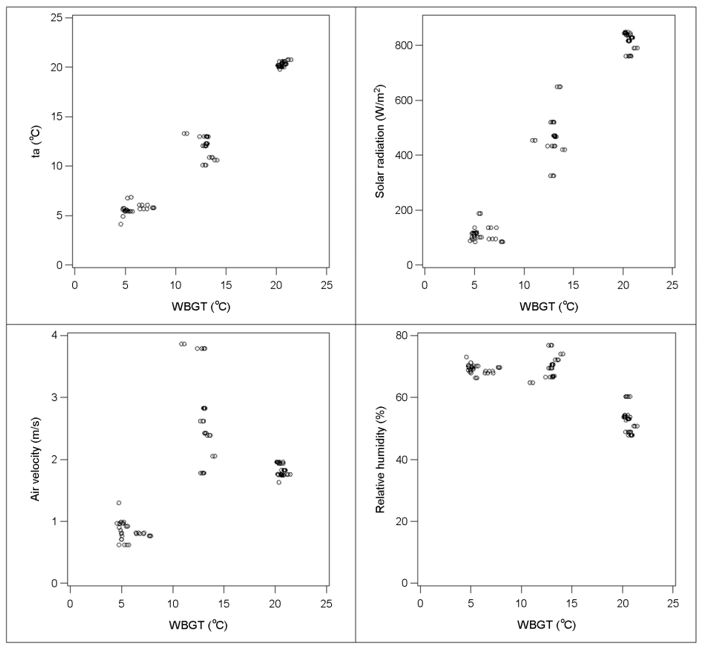
The WBGTs were measured at three levels above the ground: WBGThead, WBGTabdomen, and WBGTankles. Environmental conditions from the weather station and WBGTs are shown in Table 3.
All environmental conditions from the weather station showed significant correlation with the WBGTs (Figure 3, p<0.05). Air temperature showed the strongest correlation with the WBGTs, while solar radiation had the second highest correlation (Table 5, Figure 3). Wind speed showed the lowest correlation with WBGTs. WBGTabdomen had the highest correlation with solar radiation and wind speed (Table 5, p<0.05). However, WBGT showed a reasonably strong correlation with all four environmental parameters.
|
|
Ta (℃) |
ø (%) |
SR (Wm-2) |
V (ms-1) |
|
WBGThead |
.986 |
-.814 |
.976 |
.378 |
|
WBGTabdomen |
.984 |
-.797 |
.980 |
.401 |
|
WBGTankles |
.986 |
-.815 |
.979 |
.369 |
|
WBGT |
.986 |
-.807 |
.979 |
.387 |
A significant relationship was found between WBGT and weather conditions. The regression function using air temperature (Ta) could be derived with 97% of variance for the estimation of WBGT (°C); WBGT = 0.349 + 1.003Ta (p<0.05). WBGT could therefore be predicted by the combination of air temperature and solar radiation with 98% of variance (Table 6).
|
Explanatory
variable |
B |
Std.Error |
p-value |
|
(Constant) |
1.340 |
.231 |
.000 |
|
Ta |
.617 |
.054 |
.000 |
|
SR |
.008 |
.001 |
.000 |
If only air temperature is known, a WBGT of 15.4℃ can be anticipated by the equation when air temperature is 15℃. If environmental conditions from a weather forecast are known and a measurement is not able to be carried out, Table 6 can be used to estimate the WBGT. The value of the WBGT can be applied to the reference value (ISO 7243, 1989) of the WBGT and the result can be interpreted.
3.5 Physiological and subjective responses vs WBGTs
The WBGTs for December showed a strong correlation with all physiological and subjective responses (Table 7). June also had a significant relationship with human responses. WBGTs for March did not show any correlation with physiological and subjective responses except heart rate (p<0.05). The WBGTs for September had a significant relationship with only aural temperature.
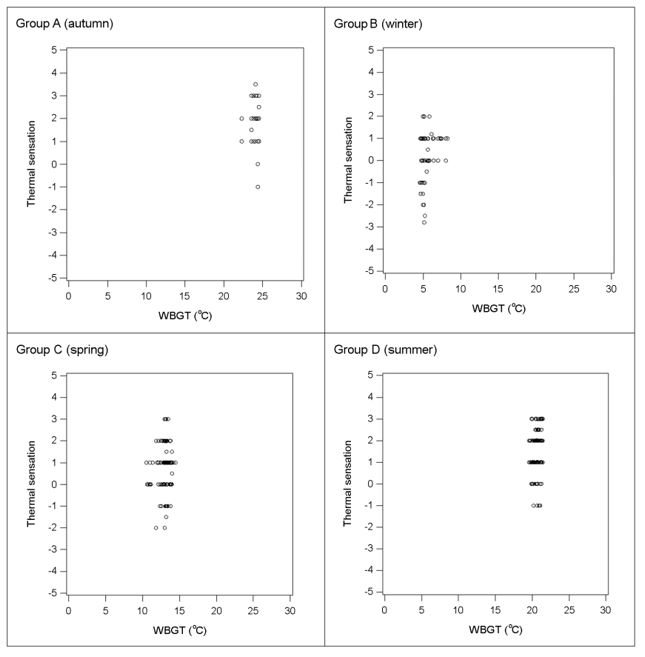
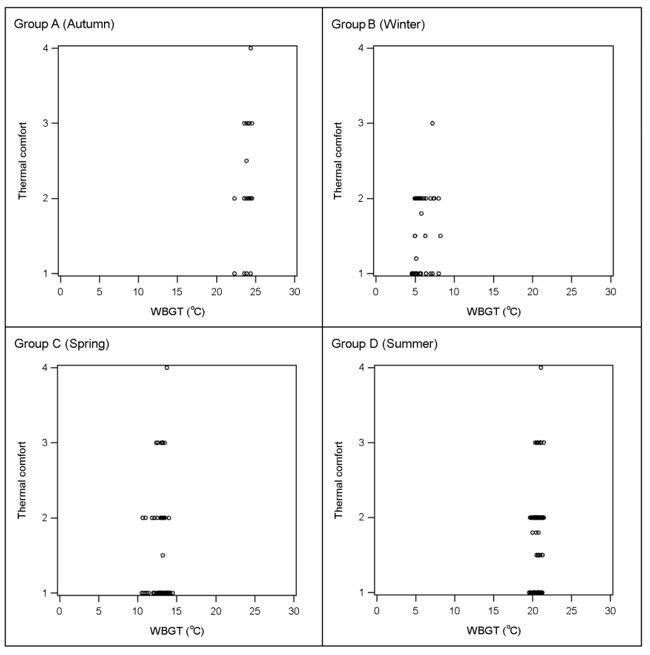
When considering overall data from all four groups, WBGT had reasonably significant correlation with the physiological and subjective responses. However, physiological and subjective responses had the highest correlation coefficients with the WBGT over 60 minutes at a head height. Sweat evaporated showed the highest correlation with the WBGTs and thermal sensation and thermal comfort had significant relationships with the WBGTs (Figures 4 and 5).
When the data of two selected groups were considered, different tendencies were observed (Table 7). September & December, which had high air temperature and solar radiation, showed relatively strong correlation with all physiological and subjective responses. On the other hand, December & March, which were exposed to a cool environment showed less relationship with aural temperature and subjective responses than June & September. Heart rate had different relationships depending on which groups were combined. Azer and Hsu (1977) suggested that WBGT was less sensitive at wind speed of more than 1.5m/s, and it seemed that WBGT became less sensitive when air temperature and relative humidity went up. This is possibly why March did not show a relationship between WBGT and human responses.
|
WBGThead |
WBGTabdomen |
WBGTankle |
WBGT |
||
|
September |
Aural temperature |
.238 |
.220 |
.287 |
.244 |
|
Heart rate |
- |
- |
- |
- |
|
|
Sweat evaporated |
- |
- |
- |
- |
|
|
Sensation |
- |
- |
- |
- |
|
|
Comfort |
- |
- |
.285 |
. - |
|
|
December |
Aural temperature |
-.193 |
-.183 |
-.158 |
-.182 |
|
Heart rate |
.095 |
.119 |
.143 |
.119 |
|
|
Sweat evaporated |
- |
- |
- |
- |
|
|
Sensation |
.273 |
.283 |
. - |
.284 |
|
|
Comfort |
.341 |
.332 |
- |
.312 |
|
|
March |
Aural temperature |
- |
- |
- |
- |
|
Heart rate |
- |
- |
-.113 |
. |
|
|
Sweat evaporated |
- |
- |
- |
- |
|
|
Sensation |
- |
- |
- |
- |
|
|
Comfort |
- |
- |
- |
- |
|
|
June |
Aural temperature |
.238 |
.194 |
.202 |
.210 |
|
Heart rate |
- |
- |
- |
- |
|
|
Sweat evaporated |
- |
- |
- |
- |
|
|
Sensation |
.281 |
.243 |
.242 |
.261 |
|
|
Comfort |
.229 |
- |
.198 |
.198 |
|
|
Autumn & June |
Aural temperature |
.463 |
.450 |
.454 |
.457 |
|
Heart rate |
.487 |
.471 |
.429 |
.470 |
|
|
Sweat evaporated |
.838 |
.840 |
.829 |
.837 |
|
|
Sensation |
.303 |
.293 |
.313 |
.301 |
|
|
Comfort |
.386 |
.362 |
.390 |
.374 |
|
|
December & March |
Aural temperature |
- |
- |
- |
- |
|
Heart rate |
.297 |
.302 |
.298 |
.300 |
|
|
Sweat evaporated |
.886 |
.888 |
.888 |
.888 |
|
|
Sensation |
.242 |
.250 |
.210 |
.237 |
|
|
Comfort |
- |
- |
- |
- |
|
|
All four groups (Total) |
Aural temperature |
.531 |
.523 |
.516 |
.524 |
|
Heart rate |
.201 |
.200 |
.174 |
.193 |
|
|
Sweat evaporated |
.873 |
.863 |
.838 |
.859 |
|
|
Sensation |
.529 |
.526 |
.521 |
.525 |
|
|
Comfort |
.347 |
.338 |
.336 |
.339 |
Four group experiments were conducted outdoors on four different days during a year, and it could be expected that physiological and subjective responses would be influenced by differently combined thermal environments including clothing, various wind speeds and solar radiation from the sun.
When the overall results of the four seasons are considered, WBGT could provide a prediction of physiological responses as well as subjective responses if aural temperature, heart rate and sweat production were measured. Hence, WBGT might be appropriate to predict thermal strain on ordinary people in moderate conditions although Korean people tended to wear more clothing which can affect their physiological and subjective responses (Kwon and Choi, 2012; Kwon et al., 2015). Further investigations considering ages and climate might be needed. Consideration should be given to include the WBGT index in warning systems for a wide range of weather conditions. However, the WBGT overestimated physiological responses of subjects. In addition, tenfold Borg's RPE was significantly different with heart rate measured for the four conditions except autumn (p<0.05). Physiological and subjective responses over 60 minutes consistently showed a similar tendency in the relationships with the WBGThead and WBGTabdomen, and it was therefore found that either WBGThead or WBGTabdomen could be measured if a measurement should be conducted at only one height. The relationship between the WBGT values and weather station data was also investigated. There was a significant relationship between WBGT values at the position of a person and weather station data. For UK daytime weather conditions ranging from an average air temperature of 6℃ to 21℃ with mean radiant temperatures of up to 57℃, the WBGT index could be used as a simple thermal index to indicate the effects of weather on people. The result of evaluation for WBGT might help to develop the smart clothing for workers in industrial sites and improve the work environment in terms of considering workers' wellness.
References
1. American college of sports medicine, ACSM's guidelines for exercise testing and prescription (Seventh ed.) Pennsylvania: Lippincott Williams & Wilkins, 2009.
Crossref
2. Azer, N.Z. and Hsu, S., OSHA heat stress standards and the WBGT index. ASHRAE Trans. 83(2), 30-40, 1977.
Crossref
3. Budd, G.M., Wet-bulb globe temperature (WBGT)-its history and its limitation. Journal of Science and Medicine in Sport, 11(1), 20-32, 2008.
Crossref
Google Scholar
PubMed
4. Holmér, I., Climate change and occupational heat stress: methods for assessment. Global Health Action 2010, 3: 5719 - DOI: 10.3402/gha.v3i0.5719, 2010.
Crossref
Google Scholar
PubMed
5. ISO 7243, Hot environments - Estimation of the heat stress on working man, based on the WBGT-index (wet bulb globe temperature). International Standards Organisation, Geneva, 1989.
Crossref
6. ISO 8996, Ergonomics of the thermal environment-determination of metabolic rate. International Standards Organization, Geneva, 2004.
Crossref
7. ISO 10551, Ergonomics of the thermal environment - Assessment of the influence of the thermal environment using subjective judgement scales. International Standards Organisation, Geneva, 2001.
Crossref
8. Kwon, J., Human responses to outdoor thermal environments. PhD thesis, Loughborough University. 2009.
Crossref
Google Scholar
9. Kwon, J. and Choi, J., The relationship between environmental temperature and clothing insulation across a year. International Journal of Biometeorology, 56, 5, 2012.
Crossref
Google Scholar
PubMed
10. Kwon, J., Park, H.S., Kim, S.H. and Lee, K.S., Impacts of gender, weather, and workplace differences in farm worker's gear. Journal of Physiological Anthropology, 34, 39, 2015.
Crossref
Google Scholar
PubMed
11. Nash, J., Don't overlook the hazards of heat stress. The Magazine for Environment, Health and Safety Leaders, May, 2004.
Crossref
12. Parsons, K.C., Heat stress standard ISO 7243 and its global application. Industrial Health, 44, 368-379, 2006.
Crossref
Google Scholar
PubMed
13. Parsons, K.C., Human thermal environments (Second ed.). London: Taylor & Francis, ISBN 0415237939, 2003.
Crossref
14. Rastogi, S.K., Gupta, B.N. and Husain, T., Wet-bulb globe temperature index: A predictor of physiological strain in hot environments. J Ocup Med, 42, 93-97, 1992.
Crossref
Google Scholar
PubMed
15. Yaglou, C.P. and Minard, C.D., Control of heat casualties at military training centers. Am. A. Arch. Indust. Health, 16, 302-316, 1957.
Crossref
Google Scholar
PubMed
PIDS App ServiceClick here!