eISSN: 2093-8462 http://jesk.or.kr
Open Access, Peer-reviewed
eISSN: 2093-8462 http://jesk.or.kr
Open Access, Peer-reviewed
Myunghwan Park
, Cheolkyu Jee
, Cheonyoung Kim
, Hyeonju Seol
10.5143/JESK.2017.36.5.535 Epub 2017 November 01
Abstract
Objective: This study was designed to identify factors affecting pilots' +Gz tolerance recovery from +Gz induced exhaustion.
Background: +Gz tolerance of pilots has been considered as a crucial factor to fly the modern high performance fighter aircrafts. However, the factors affecting pilots' G-tolerance recovery from +Gz induced exhaustion have not been examined in the acceleration research community.
Method: A centrifuge profile consisting of a high +Gz run for pilot's exhaustion and a low +Gz run for pilot's recovery and another high +Gz runs for pilot's second exhaustion was designed. The subjects' +Gz tolerance recovery ratio was measured by ratio of second high +Gz run time to the first high +Gz run time. The subjects' +Gz tolerance recovery rate was measured by dividing the subjects' +Gz tolerance recovery ratio by the low +Gz run time. The subjects' G-tolerance recovery rate was analyzed with respect to the subjects' personal factors including subjects' anthropometric and physiologic characteristics, flight time, flying aircraft type and so on.
Results: The subjects' previous three-month flight hours (r=-0.336, p=0.039), six-month flight hours (r=-0.403, p=0.012) and one-year flight hours (r=-0.329, p= 0.044) correlated with the subjects' G-tolerance recovery rate.
Conclusion: The subjects' G-tolerance recovery rate is clearly related to the subjects' previous flight hours. However, the subjects' anthropometric and physiologic characteristics do not show any statistically significant correlation with the subjects' G-tolerance recovery rate.
Application: This research provides a safety critical insight to aviation community by identifying the factors to affect the gravity-induced loss of consciousness (G-LOC) of pilots.
Keywords
Pilot's +Gz tolerance Recovery rate of +Gz tolerance G-induced fatigue
During a tactical aerial combat maneuver (TACM), pilots are frequently exposed to repeated high +Gz acceleration and relaxation. Pilots +Gz tolerance will be exhausted during high +Gz acceleration while it will be recovered during low +Gz relaxation. The primary contributor exhausting G-tolerance is fatigue which prevents the pilot from properly performing an anti-G straining maneuver (AGSM) (Burton, 1986; Tesch et al., 1983). If pilots cannot recover quickly from the fatigue, they cannot perform further maneuvering during a TACM. Thus, the recovery rate of pilots' G-tolerance during low +Gz is as important as the exhaustion rate of pilots' G-tolerance during high +Gz.
In earlier research, factors affecting the exhaustion rate of pilots' G-tolerance have been wildly explored and researched (Epperson et al., 1985; Forster et al., 2000; Gillingham and Fosdick, 1988; Hrebien and Hendler, 1983; Park et al., 2015; Swetleena, 2009). However, the factors affecting the recovery rate of pilots' G-tolerance have not been examined in the acceleration research community. To the best of our knowledge, there is very little research addressing the recovery of pilots' G-tolerance. Tong et al. (1998) experimented simulated air combat maneuver using a centrifuge with 15 peoples. They measured recovery time from G-induced fatigue and found that the recovery times varied from 21 to 42 hours depending on the pilots' anti-G equipment. Balldin et al. (2003) performed similar experiments with nine people and the average recovery time was 21 hours.
However, no previous research has focus on factors which affect the pilots' recovery time from G-induced fatigue. Furthermore, a limitation of the previous research is that the amount of fatigue and recovery time was subjectively measured by the subjects themselves.
Thus, the purpose of this study was to identify factors which can affect pilots' recovery rate of G-tolerance from G-induced fatigue. The result of this study can provide the further insight to pilots' G-tolerance characteristics and be used as a guideline to pilots who are preparing high-G maneuvering mission.
This research complied with the American Psychological Association Code of Ethics. The subjects who participated in this experiment were fully informed about the experiment protocol and gave their written consent for the experiment. In this experiment, we used a centrifuge in the Korea Air Force Aerospace Medical Center which equipped with an F-15 cockpit gondola.
2.1 Subject
Korea Air Force fighter pilots who were attending the high G-force training course in the Aerospace Medical Center at the time volunteered for the experiment. While some subjects fell into G-induced loss of consciousness (GLOC) or gave up during the experiment, 38 subjects successfully finished the experiment. We discarded all data of those who fell into GLOC or gave up the experiment since we could not obtain G-tolerance recovery rate from them. All volunteered subjects were male and their average age was 24 years old (max: 41, min: 24). The average flight hour of the subjects was 732 hours (max: 2241, min: 232). The average flight hour during the previous one-week was 2.4 hours (max: 7, min: 0) and during the previous one-month was 9.7 hours (max: 32, min: 0). The details are shown in Table 1.
2.2 Procedure
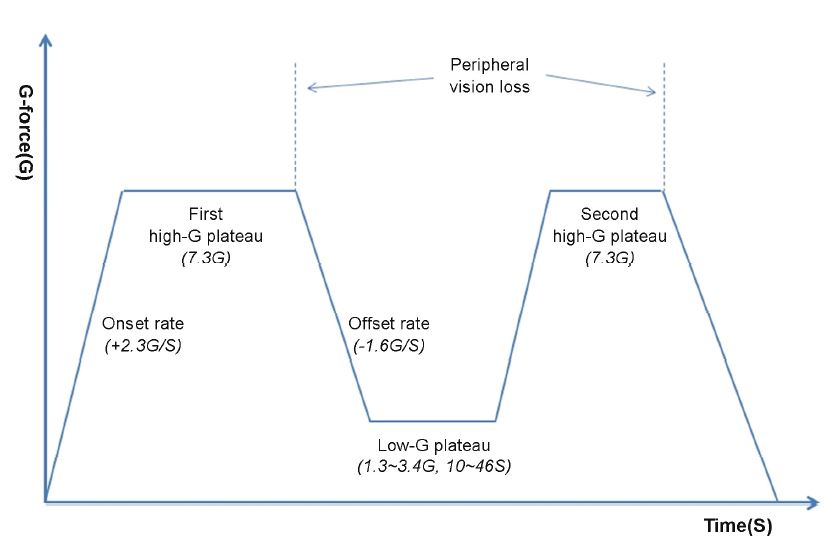
The subjects wore anti-G trousers and performed L-1 method AGSM during exposure to G-force. The G-profile consisted of a high G plateau (7.3G) and a low G plateau (1.3G~3.4G) and another high G plateau (7.3G). The onset rate of G exposure was +2.3G/S and the offset rate was -1.6G/S. The G level in the high G plateau and onset/offset rate were set by the fighter pilots' G-force training protocol of Korea Air Force. In the first high G plateau, subjects were instructed to decrease G-force to the low G plateau when they reached loss of peripheral vision. The first high G plateau was intended for subjects to completely exhaust their G-force tolerance. The low G plateau was intended to give subjects a time to recover G-tolerance for 10 to 46 seconds. Each subject was given different time and G-force during the low G plateau. We set different time for each subjects in the low G plateau to examine whether the length of rest time is an influential factor on G-tolerance recovery ratio. We also set different G-force for each subjects in the low G plateau to inspect the effect of degree of G-force on G-tolerance recovery rate during rest time. After the subjects took a short rest during the low G plateau, they went to another high G plateau to exhaust G-tolerance which they had recovered from during the low G plateau. The subjects decreased the G-force when they reached loss of peripheral vision again and finished the experiment. We assumed that the gravity tolerance of the subjects was 100% in the beginning of the first high G plateau and 0% at the end of the first high G plateau. The subjects' G-tolerance during the last high G plateau indicated subjects' G-tolerance recovery amount during the low G plateau since the subjects' G-tolerance was completely exhausted during the first high G plateau. The experiment profile is shown in Figure 1.
For methods to obtain the pilots' recovery rate of G-tolerance from G-induced fatigue, we devised two measurements. The first is the subjects' +Gz tolerance recovery ratio measured by ratio of last high +Gz run time to the first high +Gz run time as follows.
The recovery ratio of subjects' G-tolerance (%) = the time during the last high G plateau (seconds) / the time during the first high G plateau (seconds) * 100
The second is the subjects' +Gz tolerance recovery rate measured by dividing the subjects' +Gz tolerance recovery ratio by the low +Gz run time as follows.
The recovery rate of the subjects' G-tolerance (%/S) = the recovery ratio of subjects' G-tolerance (%) / the time during the low G plateau (seconds)
2.3 Measurement
Several personal factors of the subjects were selected for the experimental variables. The variables we selected were subjects' height (cm), weight (kg), systolic blood pressure (BP), diastolic BP, skeletal muscle mass (kg), body fat mass (kg), body fat ratio (%), neck size (cm), chest size (cm) and abdominal size (cm). The subjects' aircraft type, age, and flight hours were also considered as the experimental variables. Every Korea Air Force pilot has a medical checkup conducted in a hospital once every other year. During the checkup, pilots' anthropometric and physiologic values are measured. To measure the skeletal muscle mass, body fat mass, body fat ratio, neck size, chest size and abdominal size, the direct segmental multi-frequency bioelectrical impedance analysis (Ling et al., 2011) was used with InBody720 equipment. The time discrepancy between the medical checkup date and experiment date for the subjects was an average of 111 days (max: 477 days, min: 1 day).
The details of the personal factors of the experimental subjects are shown in Table 1.
|
Variables |
Max |
Min |
Average |
SD |
Median |
Skewness |
Kurtosis |
|
|
Age (years) |
41 |
24 |
29.1 |
4.03 |
28 |
1.05 |
0.73 |
|
|
Flight hour (h) |
Total |
2241 |
232 |
731.7 |
543.4 |
536 |
1.25 |
0.71 |
|
One-week |
7 |
0 |
2.4 |
2.07 |
2 |
0.95 |
0.1 |
|
|
Two-week |
15 |
0 |
4.8 |
3.67 |
4 |
1.21 |
1.19 |
|
|
One-month |
32 |
0 |
9.7 |
7.02 |
7.5 |
1.29 |
2.03 |
|
|
Three-month |
79 |
0 |
26.3 |
19.3 |
22.5 |
1.11 |
1.08 |
|
|
Six-month |
126 |
1 |
50.8 |
30.3 |
42 |
0.95 |
0.57 |
|
|
One-year |
234 |
4 |
105.9 |
54.7 |
89 |
0.6 |
0.2 |
|
|
Height (cm) |
193 |
164.7 |
174.5 |
5.6 |
174.8 |
0.83 |
2 |
|
|
Weight (kg) |
114 |
55.4 |
76.4 |
10.4 |
75.8 |
1.07 |
3.58 |
|
|
Systolic BP (mmHg) |
138 |
108 |
121.9 |
7.3 |
120 |
-0.09 |
-0.32 |
|
|
Diastolic BP (mmHg) |
88 |
57 |
75.4 |
8.3 |
75 |
-0.21 |
-0.67 |
|
|
Skeletal muscle mass (kg) |
49 |
27.2 |
34.7 |
4.5 |
34.2 |
1.11 |
2.45 |
|
|
Body fat mass (kg) |
32 |
5.9 |
15.8 |
5.6 |
15.1 |
0.76 |
0.89 |
|
|
Body fat ratio (%) |
30.4 |
10.5 |
20.3 |
5.2 |
20.7 |
-0.07 |
-0.51 |
|
|
Neck size (cm) |
41 |
34.5 |
37.5 |
1.6 |
37.3 |
0.26 |
-0.36 |
|
|
Chest size (cm) |
112.8 |
87.7 |
99.8 |
5.6 |
99.5 |
0.16 |
-0.03 |
|
|
Abdominal size (cm) |
114.5 |
69 |
86.5 |
9.1 |
85.6 |
0.99 |
1.83 |
|
The mean/max/min tolerance time of the 38 subjects was 31.6/58/20 (s) in the first high G plateau and 13.3/27/5 (s) in the last high G plateau. The mean/max/min rest time of the subjects in the low G plateau was 19.1/46/10 (s) and the mean/max/min G-force during the low G plateau was 1.7/3.4/1.3G. The distribution of the recovery ratio of the subjects' G-tolerance (%) is shown in Table 2. The mean/max/min recovery ratio of the 38 subjects' G-tolerance was 43.6/86/15 (%), respectively.
|
Recovery ratio (%) |
15 |
20 |
21 |
22 |
24 |
27 |
30 |
31 |
32 |
37 |
39 |
41 |
43 |
44 |
|
Frequency |
1 |
1 |
1 |
2 |
1 |
2 |
3 |
1 |
2 |
1 |
2 |
1 |
3 |
1 |
|
Recovery ratio (%) |
45 |
48 |
50 |
52 |
53 |
54 |
56 |
60 |
64 |
65 |
66 |
70 |
74 |
86 |
|
Frequency |
1 |
1 |
1 |
2 |
1 |
1 |
1 |
1 |
1 |
1 |
1 |
2 |
1 |
1 |
The mean/max/min recovery rate of the 38 subjects' G-tolerance was 2.4/4.7/0.8 (%/S), respectively. The distribution of recovery rate of the subjects' G-tolerance (%/S) is shown in Table 3.
|
Recovery rate (%/S) |
0.8 |
0.9 |
1.1 |
1.2 |
1.4 |
1.5 |
1.6 |
1.7 |
1.8 |
1.9 |
2.0 |
2.1 |
2.2 |
|
Frequency |
1 |
1 |
1 |
1 |
1 |
3 |
1 |
1 |
1 |
3 |
1 |
1 |
1 |
|
Recovery rate (%/S) |
2.3 |
2.4 |
2.7 |
2.8 |
3.0 |
3.1 |
3.2 |
3.3 |
3.4 |
3.5 |
3.8 |
3.9 |
4.7 |
|
Frequency |
5 |
1 |
1 |
1 |
1 |
2 |
2 |
2 |
1 |
1 |
1 |
2 |
1 |
The correlation analysis indicated that there is a relation between the time during the low G plateau (rest time) and the recovery ratio of the subjects' G-tolerance (r=0.43, p=0.007), However, the mean G-force during the low G plateau had no relation with the recovery ratio of G-tolerance with a statistically meaningful significance (r=-0.031, p=0.852). The subjects' personal factors including anthropometric and physiologic characteristics did not show any meaningful relationship with the recovery ratio of the subjects' G-tolerance.
For the recovery rate of the subjects' G-tolerance, ANOVA, T-test, correlation and regression analysis was carried out to identify any influential factors. According to a power analysis for multiple regression using the G*Power program 3.1.9.2, the minimum required sample size was 34 when the alpha was at 0.05, the desired power level was at 0.95, the number of predictors was 17, and anticipated effect size was 0.35 (large). Thus, the sample size of our experiment was satisfactory.
ANOVA analysis revealed that the subjects' aircraft type did not show any mean difference with a statistically meaningful significance in the subjects' recovery rate of G-tolerance (F=0.353, p=0.706, df=2). Because of the small sample size of the subjects, the F-16 (2) and KA-1 (4) pilots were excluded from the ANOVA analysis.
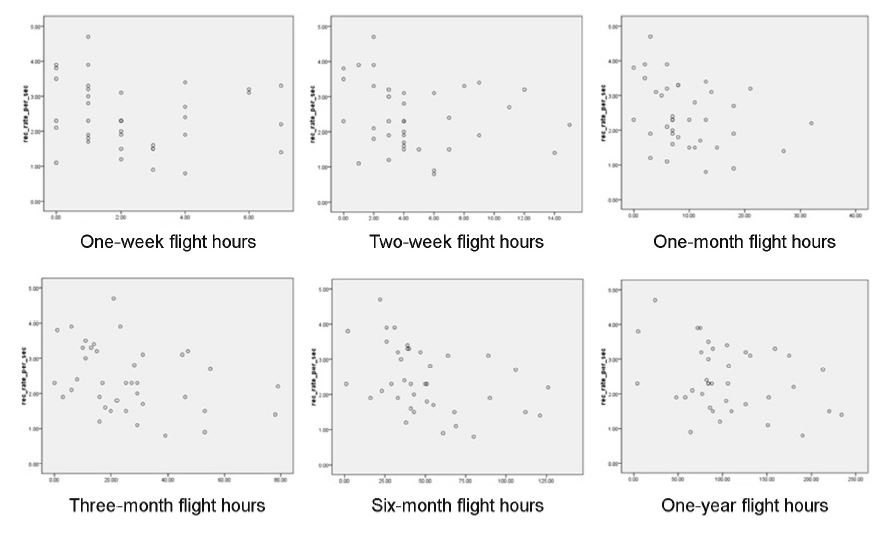
The correlation analysis showed the subjects' previous three-month flight hours (r=-0.336, p=0.039), six-month flight hours (r=-0.403, p=0.012) and one-year flight hours (r=-0.329, p=0.044) correlated with the recovery rate of the subjects' G-tolerance as shown in Figure 2.
Stepwise multiple regression analysis showed that the recovery rate of the subjects' G-tolerance could be predicted by the subjects' previous six-month flight hours (r2=0.162, p=0.012). The regression equation was as follows.
RR = 3.049 - 0.012H
where RR = recovery rate; H= six-month flight hours.
The independent sample T-test analysis performed after the value of the subjects' personal factors was simplified into "low" or "high" determined by the median values of personal factors. The T-test analysis showed that the subjects' previous one-week flight hours (t=-2.493, p=0.017, df=36), two-week flight hours (t=-2.141, p=0.039, df=36) and six-month flight hours (p=-3.123, p=0.004, df=36) had a statistically significant mean difference in the recovery rate of the subjects' G-tolerance between the "low" and "high" value groups of personal factors.
This study showed that the subjects' recovery rate of G-tolerance from G-induced fatigue could not be predicted by the subjects' physical characteristics such as anthropometric and physiologic factors. This result is consistent with the finding of previous research on subjects' G-tolerance where subjects' G-tolerance, more specifically, G-tolerance exhaustion rate could not predicted by subjects' anthropometric and physiologic factors (Webb et al., 1991).
It is quite a reasonable result that the recovery ratio of the subjects' G-tolerance is correlated with the subjects' rest time. The primary reason of the subjects' G-tolerance exhaustion is the fatigue resulting from the AGSM. Since the subjects did not need to exhaust G-tolerance for the AGSM during the rest time, the subjects could recover G-tolerance during the rest time.
It is also notable that the G-level (ranging from 1.3G to 3.4G) during the rest time in our experiment did not affect the recovery ratio of the subjects' G-tolerance. In other words, there was no difference in the recovery ratio of the subjects' G-tolerance between the rest time in 3.4G and the rest time in 1.3G. Some previous research (Burton et al., 1974; Burton, 1989; Epperson et al., 1982; Miller et al., 1959; Stoll, 1956) revealed that subjects did not fall into GLOC without performing an AGSM if the G-level was below 3.5G. Thus, subjects could equally recover from G-induced fatigue regardless of the intensity of the G-exposure if the G-force was below 3.5G.
In our experiment, the average recovery rate of subjects' G-tolerance was 2.4%/S. This means that it took 42 seconds, on average, for the subjects to fully recover from a fully exhausted state. This result conflicts with those of Tong et al. (1998) and Balldin et al. (2003) who subjectively measured subjects' recovery time ranging from 21 to 42 hours. The discrepancy between the results of our experiment and those of earlier experiments is noticeable. However, this discrepancy may be attributed to the different types of fatigue that the experiments imposed on the subjects. In our experiment, the subjects were exposed to two high G-force periods in a short period of time while subjects in earlier experiments were exposed to multiple high G-force periods over extended periods of time, which resulted in the accumulation of fatigue and a longer time to recover. The recovery rate of subjects' G-tolerance from the accumulated fatigue over long periods of time should be addressed in future research.
The correlation analysis in our experiment showed that the subjects' previous flight hours (three-months, six-months and one-year) had a correlation with the recovery rate of the subjects' G-tolerance while the subjects’ total flight hours did not have any meaningful correlation with the recovery rate (r=0.004, p=0.98). On the other hand, the independent sample T-test analysis showed that subjects' previous one-week, two-week and six-month flight hours had a statistically meaningful mean difference in the recovery rate of the subjects' G-tolerance between the less-than-median flight hour subject group and the more-than-median flight hour subject group. In both analyses, the subjects who had fewer flight hours in recent days showed the higher recovery rate than those who had more flight hours in recent days. This suggests that the accumulated G-induced fatigue over a few months can affect the recovery rate of subjects' G-tolerance. This result also indicates that flight hours over short periods (one ~ two weeks) does not show a clear-cut correlation with the subjects' recovery rate while flight hours over longer periods (over three months) clearly show a correlation with the subjects’ recovery rate, as shown in Figure 2.
Stepwise multiple regression analysis suggested that using the measurement of subjects' previous six-month flight hours is the best-fit factor to predict the subjects' G-tolerance recovery rate. However, examining the previous six-month flight hours only is too weak to precisely anticipate the rate of the subjects' G-tolerance recovery (r2=0.162).
G G-tolerance recovery rate is as important as G-tolerance exhaustion rate while G-tolerance recovery rate has not been properly addressed in the acceleration research community compared with G-tolerance exhaustion rate. Our experiment showed that the subjects' G-tolerance recovery rate is clearly related to the subjects' previous flight hours. However, the subjects' anthropometric and physiologic characteristics do not show any statistically significant correlation with the subjects' G-tolerance recovery rate.
References
1. Balldin, U.I., Werchan, P.M., French, J. and Self, B., Endurance and performance during multiple intense high +Gz exposures with effective anti-G protection. Aviation Space Environmental Medicine, 74(4), 303-308, 2003.
Crossref
Google Scholar
2. Burton, R.R., Leverett, S.D. and Michaelson, E.D., Man at high sustained +Gz acceleration. Aviation Space Environment Medicine, 45(10), 1115-1136, 1974.
Crossref
Google Scholar
3. Burton, R.R., A conceptual model for predicting pilot group G tolerance for tactical fighter aircraft. Aviation Space Environment Medicine, 57, 733-744, 1986.
Crossref
Google Scholar
4. Burton, R.R., Human Physiological Limitations to G in High-Performance Aircraft. In Physiological Function in Special Environments (pp. 123-137), Springer New York, 1989.
Crossref
Google Scholar
5. Epperson, W.L., Burton, R.R. and Bernauer, E.M., The influence of differential physical conditioning regimens on simulated aerial combat maneuvering tolerance. Aviation Space Environment Medicine, 53(11), 1091-1097, 1982.
Crossref
Google Scholar
6. Epperson, W.L., Burton, R.R. and Bernauer, E.M., The effectiveness of specific weight training regimens on simulated aerial combat maneuvering tolerance. Aviation Space Environment Medicine, 56(6), 534-539, 1985.
Crossref
Google Scholar
7. Forster, E.M., Shender, B.S. and Forster, E.C., The effect of aircrew age on +gz tolerance as measured in a human-use centrifuge. Naval Air Warfare Center Aircraft Div Patuxent River MD Crew Systems Technology Dept, 2000.
Crossref
Google Scholar
8. Gillingham, K.K. and Fosdick, J.P., High-g training for fighter aircrew. Aviation Space Environment Medicine, 59(1), 12-19, 1988.
Crossref
Google Scholar
PubMed
9. Hrebien, L. and Hendler, E., Factors affecting human tolerance to sustained acceleration (No. NADC-84021-60). Naval Air Development Center WARMINSTERPA Aircraft and Crew Systems Technology Directorate, 1983.
Crossref
Google Scholar
10. Ling, C.H., Craen, A.J., Slagboom, P.E., Gunn, D.A., Stokkel, M.P., Westendorp, R.G. and Maier, A.B., Accuracy of direct segmental multi-frequency bioimpedance analysis in the assessment of total body and segmental body composition in middle-aged adult population. Clinical Nutrition, 30(5), 610-615, 2011.
Crossref
Google Scholar
11. Miller, H., Riley, M.B., Bondurant, S. and Hiatt, E.P., The duration of tolerance to positive acceleration. Aerospace and Medicine, 30, 360-366, 1959.
Crossref
12. Park, M., Yoo, S., Seol, H., Kim, C. and Hong, Y., Unpredictability of fighter pilots’ G duration tolerance by anthropometric and physiological characteristic. Aerospace Medicine and Human Performance, 86(4), 397-401, 2015.
Crossref
Google Scholar
13. Stoll, A.M., Human tolerance to positive G as determined by the physiological end point. Aerospace and Medicine, 27, 356-67, 1956.
Crossref
Google Scholar
14. Swetleena. A study of the relationship between physical fitness and +gz tolerance among young healthy Indian women. MD thesis. Rajiv Gandhi University of Health Sciences, Bangalore, India, 2009.
Crossref
15. Tesch, P.A., Hjort, H. and Balldin, U.I., Effects of strength training on g tolerance. Aviation Space Environment Medicine, 54(8), 691-695, 1983.
Crossref
Google Scholar
16. Tong, A., Balldin, U.I., Hill, R.C. and Dooley, J.W., Improved Anti-G protection boosts sortie generation ability. Aviation Space Environment Medicine, 69(2), 117-120, 1998.
Crossref
Google Scholar
17. Webb, J.T., Oakley, C.J. and Meeker, L.J., Unpredictability of fighter pilot g tolerance using anthropometric and physiologic variables. Aviation Space Environment Medicine, 62(2), 128-135, 1991.
Crossref
Google Scholar
PIDS App ServiceClick here!