eISSN: 2093-8462 http://jesk.or.kr
Open Access, Peer-reviewed
eISSN: 2093-8462 http://jesk.or.kr
Open Access, Peer-reviewed
Guo Fen
, Younghwan Pan
10.5143/JESK.2020.39.5.423 Epub 2020 November 02
Abstract
Objective: By establishing the weight relationship between the factors of interior colour and perceptual semantics and using it as a guide, designers can more quickly and more accurately design the interior colours thatusers desire.
Background: From past work experience, it was found that, due to differences in cognition and understanding in the process of communicating with users, the final design effects often cannot accurately reflect the real needs of our users. This challenge results in repeated communication and modification, which costs a considerable amount of time and greatly reduces the work efficiency. Kansei Engineering can solve this problem effectively. The existing research of Kansei Engineering is mainly focused on the terms of automobiles and products, with just a few related to interior design.
Method: By analysing the principle of interior colour collocation, typical original samples were selected with focus groups to create research samples of immersive 3D panoramic renderings for experiments. Through a questionnaire survey, user's perceptual images of the ideal home space and typical samples were collected. The most suitable perceptual semantic vocabulary for the samples were then selected by means of factor analysis. Taking the word 'concise' as an example, we first employed the fuzzy matrix analysis method to calculate the weight value of each color design factor at each level (expert group), and then used the Likert scale to investigate user data (user group). Finally, the above two groups of data were combined to form the final weight value of each interior color design factor for the perceptual semantic word 'concis'.
Results: The model can effectively analyse the weight values between the perceptual semantic word 'concise' and various interior colour design factors. Among the secondary factors, the furniture hue is the highest in the comprehensive weight value, and among the third factors, the furniture colour white is the highest of all factors.
Conclusion: The model that combines Kansei Engineering, factor analysis and fuzzy hierarchical analysis can effectively calculate the weight value of the perceptual semantic vocabulary in each design factor. It has direct significance for designers and provides new ideas for further realization of AI-automated interior design.
Application: The research on home interior colour design based on immersive VR rendering experience can be applied to the design scheme phase of home interior design projects.
Keywords
VR renderings Home interior design Colour design Kansei Engineering Fuzzy Analytic Hierarchy Process (FAHP)
In the past work of interior design, we found that, due to differences in cognition and understanding in the process of communicating with users, the final design effects often cannot accurately reflect the real needs of our users. Customers usually create some interior design vocabulary and vague vocabulary according to their own aesthetic experience, such as Japanese design, concise and easy design, fresh and comfortable feeling, etc. However, when the designer designs according to the users' feelings and vocabulary, it is difficult to accurately capture the image and style that they expect. Therefore, it requires repeated communication and modification to achieve the users' expectation. In this way, it is difficult to effectively improve the work efficiency.
The main design entry point of this article is the interior colour design. As one of the most important features in the product visual system, colour is not only a matter of visual beauty but also contains people's physical and psychological needs. The paper results by Mitsuhiko Hanada demonstrated the usefulness of correspondence analysis for analyzing color-emotion associations due to its ability (Hanada, 2017). Furthermore, balance between the amount of colour and the amount of surface is an important factor in influencing the user's psychological state; adequate change in dominant colours, accent colours and secondary colours can bring positive psychological effects.
The balance between these colours creates different psychological effects in spaces with both short-term and long-term use. Colour contains two opposite properties that generate both negative and positive reactions: it stimulates and tempts us, evoking impulses and displeasure, but also gives us comfort and stability. The physical, physiological and psychological effects of colour are particularly apparent in an interior space. In the field of related color research, the main areas of product design, such as Knowledge Expression of Product Color Image Based on Ontology (Zhang et al., 2019), Application of Metaphorical Characteristics of Color in Mobile Phone UI Design (Liu et al., 2018).
This article introduces the methods of Kansei Engineering (Luo and Hong, 2015) and Fuzzy Analytic Hierarchy. The past research of Kansei Engineering has mainly involved product design, furniture design, automobile design, etc. E.g, Application studies to car interior of Kansei engineering (Tomio and Kiyomi, 1997), Affective Evaluation of Interior Design of Commercial Cars using 3D Images (Park et al., 2014), Innovative research on furniture modeling using the methods of Kansei Engineering (Zhang and Huang, 2012), Car body color design based on Kansei engineering and principal component analysis (Su et al., 2016.). From the Department of Product Design, Taiwan University, used kansei Engineering to evaluate the relationship between the components and the whole in the design of automobile steering wheels (Chang and Chen, 2016). The method of Kansei Engineering has been adopted to discuss the Western style and the functional category of the living room (Wang and Hsiao, 2018). This is one of the few articles that uses Kansei Engineering to discuss interior design. The Fuzzy Analytic Hierarchy Process has mainly been applied to index evaluation and mathematical theory. In this paper, the author introduces these two methods into the colour design of interior spaces. The weight relationship between indoor colour factors and perceived semantic "simplicity" is established. This method also derives the weight relationship between other perceptual semantics and indoor colour factors and guides designers to more quickly and more accurately design the indoor colours that users need to further explore the possibilities of colour design in indoor spaces.
2.1 Identify perceptual semantic vocabulary
2.1.1 Participants
The participants of the experiment were divided into two groups, one of which was a professional group, consisting of professional design practitioners (5 people) and design education experts (5 people), for the collection and screening of experimental samples. Another group of users consisted of 30 people (18 women and 12 men) with an average age of 28, which was not included in the experiment, for the screening of perceptual semantics.
2.1.2 Create experiment samples
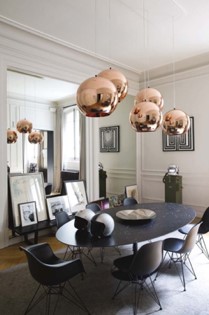
In the process of sample collection, first there are 10 interior designers, each collecting the 10 most popular sets of interior design schemes for a total of 100 sets. Then, the focus group found that most of the background colours (wall colours) of the samples were white series. Next were grey, beige and all types of colours. To perform the study accurately, we focused the research scope in the white series, which has the largest sample size. Through the focus group, we selected 24 typical samples from the white series of samples. The samples were collected from different channels, including real scenes, network pictures, books and photos.
|
Original sample |
Area |
Research sample |
|
|
|
The effect of the samples was influenced by factors such as light, pixels, shooting angle and so on. To more objectively present the original version of colour matching and maintain the accuracy of the post-research, the typical samples were extracted as follows:
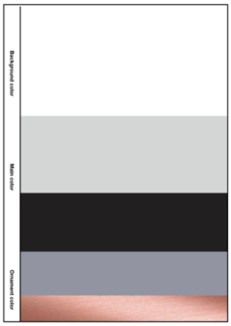
(1) Referring to othersets of typical samples, extract the colours according to the area proportion to form colour matching reference diagrams.
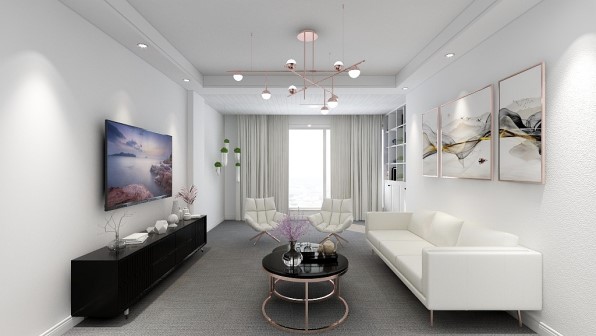
(2) According to the extracted colour matching diagrams, create a VR panoramic rendering of the same space according to the principle of matching background colour-theme colour-ornament colour (Table 1).
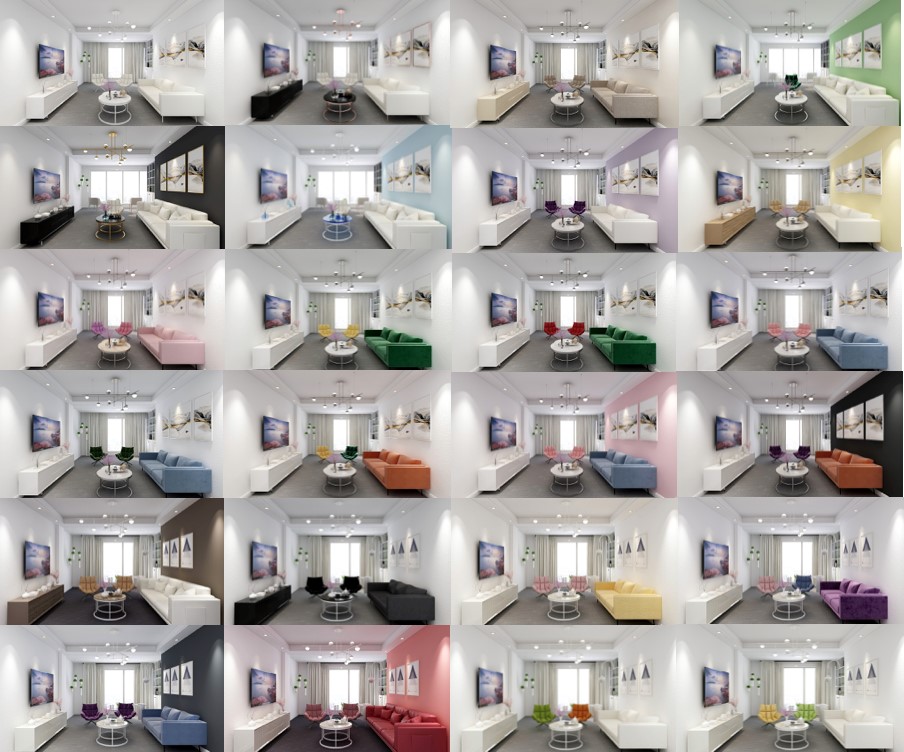
(3) According to the same methods as above, a total of 24 typical VR panoramic renderings were obtained (Figure 1).
2.1.3 Experimental conditions and methods
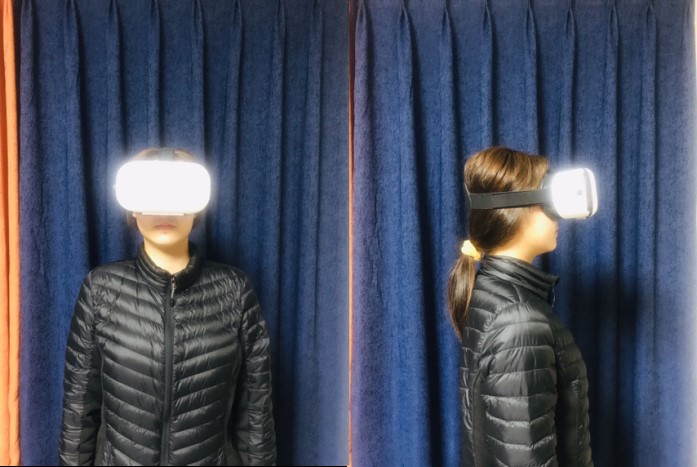
All research processes use VR virtual reality glasses (Figure 2) to make the testers more realistically feel the different feelings brought by different colour design samples. Taking a repeated measures factorial design, after each participant saw a VR panoramic case, they filled in the corresponding Semantic scale to get the score.
2.1.4 Factor analysis method
The selection of perceptual semantics was obtained by two questionnaire surveys. The first survey was conducted on perceptual images of typical samples, and the second was a survey concerning feelings of the ideal home. A total of 68 adjectives were collected, and after deleting repeated or similar terms, 18 were left. Factor analysis was performed on the 18 words, finally yielding 4 typical adjectives.
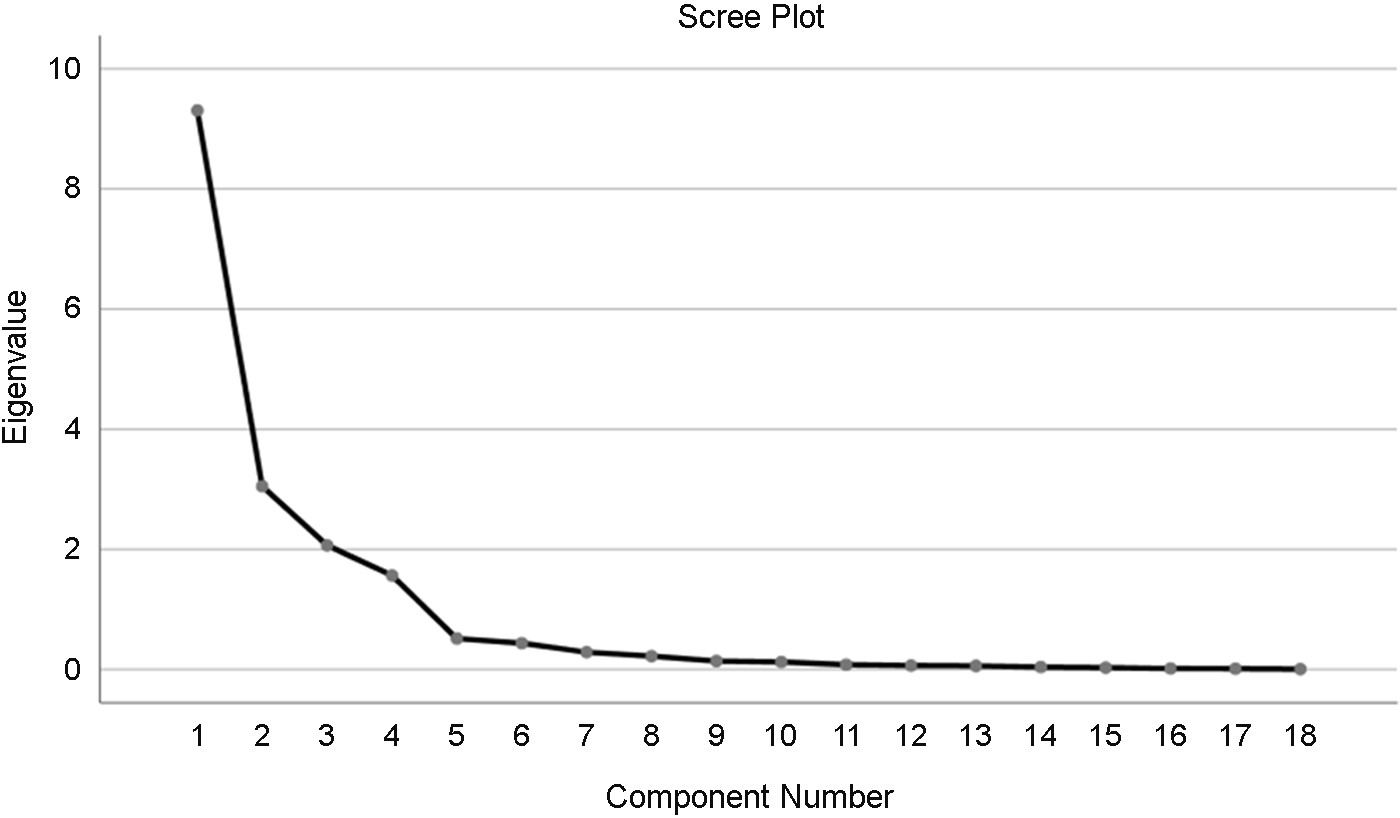
The process of factor analysis is as follows: ① Select the user group to investigate, take the 18 words as variables, and successively rate the 24 typical samples on the Likert scale (score of 1-5); the higher the score, the closer the sample is to the word. ② Calculate the average value of the corresponding words of each sample. ③ Input the data into SPSS software for factor analysis. Obtain the KMO and Bartlett's Test values (Table 2), as well as the scree plot (Figure 3) and the rotated composition matrix (Table 3).
|
KMO and Bartlett's test |
||
|
Kaiser-Meyer-Olkin Measure of Sampling
Adequacy. |
|
0.71 |
|
Bartlett's test of sphericity |
Approx. Chi-Square |
529.562 |
|
df |
153 |
|
|
Sig. |
0 |
|
|
Rotated
component matrix |
|||||
|
Classification |
Component |
||||
|
1 |
2 |
3 |
4 |
||
|
Stable |
Mature |
0.938 |
0.072 |
-0.153 |
0.208 |
|
Steady |
0.917 |
0.272 |
-0.136 |
0.190 |
|
|
Serious |
0.89 |
0.302 |
-0.213 |
0.186 |
|
|
Youth |
-0.888 |
-0.204 |
0.294 |
-0.040 |
|
|
Reason |
0.881 |
0.371 |
-0.088 |
0.092 |
|
|
Concise |
Pure |
0.038 |
0.865 |
-0.204 |
0.347 |
|
Concise |
0.339 |
0.767 |
-0.242 |
0.361 |
|
|
Warm |
-0.384 |
-0.718 |
0.184 |
0.295 |
|
|
Modern |
|
0.688 |
0.417 |
0.046 |
|
|
Simple |
0.434 |
0.674 |
-0.237 |
0.267 |
|
|
Fashionable |
Fashionable |
-0.067 |
-0.065 |
0.926 |
-0.22 |
|
Personality |
-0.216 |
-0.035 |
0.909 |
-0.173 |
|
|
Creativity |
-0.244 |
-0.169 |
0.879 |
-0.171 |
|
|
Fashion |
-0.531 |
-0.312 |
0.663 |
-0.068 |
|
|
Peaceful |
Safety |
0.308 |
0.176 |
-0.223 |
0.868 |
|
Peace |
0.274 |
0.168 |
-0.241 |
0.832 |
|
|
Be quiet |
0.212 |
0.402 |
-0.258 |
0.78 |
|
|
Comfortable |
-0.433 |
-0.504 |
0.036 |
0.704 |
|
|
Extraction Method: Principal
Component Analysis. Rotation Method: Varimax
with Kaiser Normalization. A rotation converged in 5
iterations. |
|||||
As we can see from the above table, KMO is 0.710, greater than 0.6, which meets the prerequisites of factor analysis, indicating that the sample data can be used in factor analysis research. The data also passed the Bartlett sphericity test (p<0.05), which shows that the research sample data is suitable for factor analysis.
The rotated component matrix table shows the extraction of typical sample information by factors and the corresponding relationship between factors and typical samples. It can be seen from the above table that the common degree value of all samples is higher than 0.4, which means that there is a strong correlation between samples and factors, and factors can effectively extract the information. After ensuring that the factor can extract most of the information of the sample, analyse the corresponding relationship between the factor and the sample (when the absolute value of the factor loading coefficient is greater than 0.4, it means that the item has a corresponding relationship with the factor). Combined with the number of factors that are suitable for extraction from the gravel diagram, finally extract four effective factors as 'stable, concise, fashionable and peaceful'.
2.2 Fuzzy Analytic Hierarchy Process (FAHP)
2.2.1 Participants
The fuzzy analytic hierarchy process was completed in two surveys. The first survey was regarding the hierarchy and elements of colour design elements. Due to the strong professionalism of the survey, its objects need to have certain professional knowledge, so the first survey objects were selected by a professional group, consisting of professional design practitioners (5 people) and design education experts (5 people). On the basis of the first survey, the second survey compared the design elements in pairs and was scored by the expert group. Finally, the fuzzy hierarchy analysis was carried out.
2.2.2 Determine interior colour design elements
Interior colour design is mainly divided into three categories: background colour, main colour and ornament colour. Different types of colours play a different role, and they complement each other and are closely related. The background colour is the colour that occupies the most area of the work and generally refers to the colour of the space interface, such as the wall, ceiling and ground. The main colour is the colour matched with the advocate colour, generally referring to the indoor furniture. The background colour of the space and the main colour do not exceed three types in general. The ornament colour is the colour used to decorate the colour of the picture, such as green, pillow, decoration, etc (Zeng and Zhen, 2006). The three elements of colour include hue, lightness and purity. Combining the above-mentioned indoor colour classification, deconstruct the design elements of home interior colour and initially determine the design elements.
Using the 5-level Rick scale method, a colour element decomposition table was established for the preliminary determined design elements in the order of items, categories, and elements to form a questionnaire survey. Through the investigation of the members of the expert group, the interior colour design is finally divided into 3 levels and 24 elements (Table 4).
|
Level 1 |
Level 2 |
Level 3 |
Level 1 |
Level 2 |
Level 3 |
|
Background |
Wall Hue |
White, black, |
Main colour |
Furniture hue |
White, black, cold, warm |
|
Wall Chrome |
0~33, 34~67, |
Furniture purity |
0~33, 34~67, 68~100 |
||
|
Wall lightness |
0~33, 34~67, |
Furniture lightness |
0~33, 34~67, 68~100 |
||
|
Furniture colour matching |
Monochrome, analogous colours, adjacent colours, contrast colours |
2.2.3 Determine expert weight value
The analytical hierarchy process was put forward as early as the 1970s by the American operations researcher TLSAATY. It decomposes the total target into relevant hierarchical structures and adopts a multi-objective and multi-scheme decision-making method combining qualitative and quantitative analysis on the basis of stratification. It is widely used in various research fields to solve multi-factor and multi-level unstructured decision-making problems (Zhang, 2003).
When using the analytical hierarchy process to construct the index weight system, experts are needed to score and judge the importance between the two elements, which is somewhat subjective. To eliminate the subjectivity of expert scoring and improve the accuracy and practicability of the analytical hierarchy process in establishing index weights, the fuzzy judgement matrix is introduced on the basis of the analytical hierarchy process--fuzzy analytic hierarchy process. The research results of Zhang Jijun et al. show that, compared with the traditional analytical hierarchy process, the relational ordering method of fuzzy judgement matrix elements and weights has obvious advantages, reducing the complexity of calculation and improving the resolution of the calculation results. It is conducive to improving the scientificity of decision-making. The specific process is as follows:
(1) Construct a pairwise comparative judgement matrix. The process adopts a questionnaire survey to construct a comparative judgement matrix. Select 5 field experts and 5 industry experts, distribute questionnaires to them, and instruct them to compare and score the index items according to their own experience. The importance of each index item to the perceptual semantic dimension of 'concise' is expressed in the form of a matrix. The scale method of 0, 0.5, 1 is adopted to determine the values of each factor, and the details are as follows:
Due to the limitation of space, the author selected the comparative matrix constructed by expert 1 on the background colour dimension index of the second layer and the judgement matrix Z constructed by expert 1 on the background colour of the second layer, as shown in Table 5.
|
|
Wall Hue |
Wall Chrome |
Wall lightness |
|
Wall Hue |
0.5 |
1 |
0 |
|
Wall Chrome |
0 |
0.5 |
0.5 |
|
Wall lightness |
1 |
0.5 |
0.5 |
(2) The comparative judgement matrix is converted into a fuzzy comparative matrix. For instance, convert the comparative judgement matrix constructed by expert 1 into a fuzzy comparative matrix. The specific steps are as follows:
① The comparative judgement matrix is summed on the rows and columns, respectively, according to the following formulas.
② Each element in the matrix is transformed according to formula 2.4
|
|
Wall Hue |
Wall Chrome |
Wall lightness |
|
Wall Hue |
0.83 |
0.58 |
0.58 |
|
Wall Chrome |
0.58 |
0.33 |
0.33 |
|
Wall lightness |
0.58 |
0.33 |
0.33 |
According to the above steps and formulas, the comparative judgement matrix Z constructed by expert 1 is transformed into the fuzzy comparative judgement matrix FZ, as shown in Table 6.
(3) Calculate the weight of each indicator. According to the obtained fuzzy judgement matrix and formula 2.5, the weight of each indicator in Table 2.3 is calculated as follows: WFZ = [0.375,0.625]. According to the above steps for calculating the weight of each level of indicators relative to the target of the previous level, the weights of all indicators can be obtained. Utilize the Python programming language to calculate the indicator weight of each expert's score and take the weighted average value as the weight of each indicator.
n is the number of indicators; to improve the resolution ratio of the ranking results
3.1 Expert weight value result
Table 7 shows the expert weight values after the fuzzy matrix of each level factor.
|
Level-1 |
Level-2 |
Expert |
Synthetic |
Level-3 |
Expert |
Synthetic |
|
Background |
Wall
Hue |
0.4166 |
0.1562 |
White |
0.35416 |
0.0553 |
|
Black |
0.3125 |
0.0488 |
||||
|
Cold |
0.20833 |
0.0325 |
||||
|
Warm |
0.125 |
0.0195 |
||||
|
Wall
Chrome |
0.25 |
0.0937 |
0~33 |
0.458 |
0.0429 |
|
|
34~67 |
0.375 |
0.0351 |
||||
|
68~100 |
0.167 |
0.0156 |
||||
|
Wall
lightness |
0.3333 |
0.1249 |
0~33 |
0.167 |
0.0208 |
|
|
34~67 |
0.333 |
0.0416 |
||||
|
68~100 |
0.5 |
0.0624 |
||||
|
Main colour |
Furniture
Hue |
0.3333 |
0.2083 |
White |
0.35416 |
0.0737 |
|
Black |
0.3125 |
0.0651 |
||||
|
Cold |
0.20833 |
0.0434 |
||||
|
Warm |
0.125 |
0.0260 |
||||
|
Furniture
Chrome |
0.2083 |
0.1302 |
0~33 |
0.45833 |
0.0596 |
|
|
34~67 |
0.375 |
0.0488 |
||||
|
Main colour |
Furniture
Chrome |
0.2083 |
0.1302 |
68~100 |
0.1666 |
0.0216 |
|
Furniture
lightness |
0.1458 |
0.0911 |
0~33 |
0.1666 |
0.0151 |
|
|
|
|
34~67 |
0.333333 |
0.0303 |
||
|
|
|
68~100 |
0.5 |
0.0455 |
||
|
Furniture
colour |
0.3125 |
0.1953 |
Monochromatic |
0.35416 |
0.0691 |
|
|
|
|
Similar
colours |
0.145833 |
0.0284 |
||
|
|
|
Analogous
colour |
0.29166 |
0.0569 |
||
|
|
|
Contrasting
colours |
0.208333 |
0.0406 |
3.2 Add the weight value result of user data
All of the above is the weighted data results for the fuzzy analytical hierarchy of experts. To present the more real data, it is also necessary to add the user's survey data. The Likert scale was used for questionnaire surveys on users. Combining the user survey data with the weight calculated by the experts for the fuzzy hierarchy, the final comprehensive weight scores of colour design factors were obtained (Table 8).
|
Level
2 |
Level
3 |
||||||
|
|
Survey |
Synthetic |
Weighted |
3 |
Survey |
Synthetic |
Weighted |
|
Wall
Hue |
3.86 |
0.1563 |
60.3318 |
White |
5 |
0.0553 |
27.65 |
|
Black |
4 |
0.0488 |
19.52 |
||||
|
Cold |
3.33 |
0.0325 |
10.8225 |
||||
|
Warm |
1.67 |
0.0195 |
3.2565 |
||||
|
Wall
Chrome |
3.29 |
0.0938 |
30.8602 |
0~33 |
2.5 |
0.0429 |
10.725 |
|
34~67 |
2.5 |
0.0351 |
8.775 |
||||
|
67~68 |
2.5 |
0.0156 |
3.9 |
||||
|
Wall
lightness |
3.43 |
0.125 |
42.875 |
0~33 |
1.67 |
0.0208 |
3.4736 |
|
34~67 |
2.67 |
0.0416 |
11.1072 |
||||
|
67~68 |
4.33 |
0.0624 |
27.0192 |
||||
|
Furniture
Hue |
4.57 |
0.2083 |
95.1931 |
White |
5 |
0.0738 |
36.9 |
|
Black |
4 |
0.0651 |
26.04 |
||||
|
Furniture
Hue |
4.57 |
0.2083 |
95.1931 |
Cold |
3.33 |
0.0434 |
14.4522 |
|
Warm |
1.5 |
0.026 |
3.9 |
||||
|
Furniture |
3.43 |
0.1302 |
44.6586 |
0~33 |
2.67 |
0.0596 |
15.9132 |
|
34~67 |
2.33 |
0.0488 |
11.3704 |
||||
|
67~68 |
2 |
0.0216 |
4.32 |
||||
|
Furniture
lightness |
3.29 |
0.0911 |
29.9719 |
0~33 |
2 |
0.0151 |
3.02 |
|
34~67 |
2.67 |
0.0303 |
8.0901 |
||||
|
67~68 |
4.5 |
0.0455 |
20.475 |
||||
|
Furniture
colour |
4.29 |
0.1953 |
83.7837 |
Monochrome |
5 |
0.0691 |
34.55 |
|
Similar
colours |
3.83 |
0.0284 |
10.8772 |
||||
|
Adjacent
colour |
3.17 |
0.0569 |
18.0373 |
||||
|
Contrast
colours |
1.17 |
0.0407 |
4.7619 |
||||
According to the above table (Table 8), it can be seen that, among the secondary factors, the factor that has the highest impact on simplicity is the hue of the furniture, with a weight value of 95.1931. Among the lower triple factors, the highest is white, with a weight value of 36.9%, which is the highest in the hue of furniture. Then, black, cool colour and warm colour followed, with a weight value of 26.04. In other words, when the hue of furniture is all white, the entire colour feeling is the most concise, and next is black. The second largest weight value of the secondary factors is the furniture colour collocation, with a weight value of 83.7873%. The highest synthesis weight value of the colour collocation is monochromatic scheme among the triple factors, with 34.55%. The third largest weight value of the secondary factors is the hue of the wall, with a weight value of 60.3318%. The white comprehensive weight value is the highest in the wall hue, with 27.65. Combined with the comprehensive analysis of the above data, when the colour collocation wall in the household space is white and the furniture is all white single colour, it feels the most concise. In contrast, the last blue value is the lowest weight value. According to the cent value from small to large, it is the low brightness of the furniture, the warm colour of the wall, the low brightness of the wall, the warm colour of the furniture, the high brightness of the wall, and the furniture collocation are comparative colour. That is, when the wall furniture of the interior space is the warm colour with high saturation and the colour collocation is comparative colour, the complexity degree of the space is the highest.
Prior perceptual engineering research has mainly concentrated on the product and automotive fields. These are all objects used by people, and the house, as the "product" most closely related to people, can benefit from the same method. However, it is difficult to apply the method of perceptual engineering to study the colour of living space because space has a complexity that is incomparable with that of ordinary products, and fuzzy hierarchical analysis has been used in the multi-level evaluation system in the past, which just fits the space factor. Multi-level features. Combining the above two can relatively objectively analyse the weight relationship between the user's perceptual semantics and the factors.
In previous indoor colour research, somebody used genetic algorithms to study Beijing residents' preference for indoor colour design and used data analysis to explain a phenomenon of colour preference (Huang and Xu, 2009), but it could not be directly applied to actual colour design.The traditional interior colour design process is mainly the subjective evaluation of individual colours and combined colours. The colour itself is the starting point. This evaluation is not supported by research data and is often far from the actual needs of users. The research of this paper is based on user experience as the starting point, investigating user data and expert evaluation data, combining the hierarchical characteristics of interior design colour factors, and using a perceptual engineering and fuzzy analytic hierarchy process to more scientifically present the weight between feelings and factors. Relations solve practical communication and design problems.
The research process of this paper started with a sample study, combining Kansei Engineering, factor analysis and a fuzzy hierarchical analysis process. We used the same method to calculate the weight values of other dimensions of perceptual semantic vocabulary in each design factor. It is of great guiding significance to designers, especially in the scheme design stage, which can effectively guide the designers to conduct the interior colour design, accurately capture the user's requirements, and improve their work efficiency.
We can use this method not only for interior colour but also to continue discussing interior material design, lighting design, modelling design, etc. This provides new research ideas for further realization of AI-automated interior design by forming the data of Multi-Level Fuzzy Matrix Analysis.
References
1. Chang, Y.M. and Chen, C.W., Kansei assessment of the constituent elements and the overall interrelations in car steering wheel design, International Journal of Industrial Ergonomics, http://dx.doi.org/10.1016/j.ergon.2016.09.010 (retrieved September 24, 2016).
Google Scholar
2. Hanada, M., Correspondence analysis of color-emotion associations, Color Research & Application, 43(2), 224-237, 2017.
Google Scholar
3. Huang, W.X. and Xu, W.G., Interior Color Preference Investigation Using Interactive Genetic Algorithm, Journal of Asian Architecture and Building Engineering, 8(2), 439-445, 2009. doi:10.3130/jaabe.8.439
Google Scholar
4. Liu, X.Y. Wang, K. and Wang, Q., Application of Metaphorical Characteristics of Color in Mobile Phone UI Design, Packaging Engineering, 39(8), 200-204, 2018.
5. Luo, L.X. and Hong, L., Perceptual engineering design, 1nd ed., 2015.
6. Park, K., Park, J., Kim, S.M., Choe, J. and Jung, E.S., Affective Evaluation of Interior Design of Commercial Cars using 3D Images, Journal of the Ergonomic Society of Korea, 33(6), 515-532, 2014. doi:10.5143/JESK.2014.33.6.515
Google Scholar
7. Su, C., Fu, L.M., Wei, J., Li, S., Huang, L. and Cao, Y., Design method in exterior color based Kansei engineering and principal component analysis, Journal of Jilin University (Engineering and Technology Edition), 46(5), (1414-1419), 2016.
8. Tomio and Kiyomi, Application studies to car interior of Kansei engineering, International Journal of Industrial Ergonomics, 19(2), (105-114), 1997.
Google Scholar
9. Wang, M.F. and Hsiao, S.W., A Kansei-oriented Method for Interior Design, Proceedings of the 2018 IEEE 22nd International Conference on Computer Supported Cooperative Work in Design (CSCWD), 485-490, 2018.
Google Scholar
10. Zeng, X.L. and Zhen, W.L., Principles of Interior Design (Vol. 1), 2nd ed., 2006.
11. Zhang, J.J., Comparative Research on Three Sorting Methods of Fuzzy Consistent Judgment Matrix, System Engineering and Electronics, 25(11), 1370-1372, 2003. 1001-506X(2003)11-1370-03
12. Zhang, X.X., Yang, M.G., Zhang, S.T. and Qiu, K., Knowledge Expression of Product Color Image Based on Ontology, Packaging Engineering, 40(8), (41-46), 2019. doi:10.19554/j.cnki.1001-3563.2019.08.007
13. Zhang, Z.F. and Huang, K., Study on innovative design of furniture shaping based on kansei engineering, Journal of Central South University of Forestry & Technology, 32(11), 195-199, 2012.
Google Scholar
PIDS App ServiceClick here!