eISSN: 2093-8462 http://jesk.or.kr
Open Access, Peer-reviewed
eISSN: 2093-8462 http://jesk.or.kr
Open Access, Peer-reviewed
Jooyeon Ko
, Hyun Kyoon Lim
10.5143/JESK.2024.43.6.497 Epub 2025 January 07
Abstract
Objective: The total time for double-leg, tandem, and left and right single-leg stances (DLS, TS, L-SLS and R-SLS) is often used to evaluate the stability of the elderly. To provide a detailed information of the elderly motor control ability, muscle activity data are essential.
Background: Several stance tests have been used to assess the likelihood of future falls in older adults. Incorporating muscle activity data into stability analysis, alongside stance tests, would provide a more reliable quantitative indicator of postural stability.
Method: We collected surface electromyography (sEMG) data from six muscles in each leg of 22 elderly participants (70.3±4.2 years old) and evaluated them using the brain motor control assessment (BMCA) protocol, focusing on magnitude and similarity index (SI). Fifteen participants who could hold maintain stances for at least 10 seconds or longer formed the control group, while seven participants who held the stances for less than 10 seconds were placed in the test group.
Results: For the right single-leg stance (R-SLS), the control group showed 28.1(±3.5) seconds, while the test group averaged 8.9(±4.6) seconds. The total average EMG magnitude for all stances in the control group was 120.0(±45.6)uV, compared to 131.6(±75.5)uV in the test group (p > 0.56). The SI was 0.94(±0.04) for the control group and 0.84(±0.15) for the test group (p < 0.02). No significant difference was found between right and left side. Notably, two test group participants had low SI values for all stances (average SI = 0.69±0.16 and 0.60±0.12).
Conclusion: We applied the BMCA protocol to analyze sEMG patterns in healthy older adults during standing tests. The similarity index shows promise as an effective screening tool for identifying those at risk of stability issues. Additionally, the BMCA protocol could be useful for monitoring motor control abilities in older adults across various stability tests.
Application: This study used the BMCA protocol to evaluate sEMG during these stances, suggesting that SI and maintenance time could be effective screening tools for identifying elderly individuals with balance difficulties.
Keywords
Electromyography Single leg stance Similarity index Brain Motor Control Assessment (BMCA) Screening tool
Postural stability while standing is an important index to monitor the physical health condition of older adults (Chaudhry et al., 2005). Some older adults are at high risk of falling and need an appropriate tool to evaluate and anticipate the likelihood of future falls (Shumway-Cook et al., 1997; Ambrose et al., 2013). Three tests, including the double-leg stance (DLS) test, the tandem stance (TS) test, and the right and left single-leg stance (R-SLS and L-SLS) tests are often used to measure the stability of an individual, especially older adults. The test-retest reliabilities of DLS, TS, and SLS are good to excellent in healthy young adults in their twenties (Williams et al., 2017). Postural stability while holding an SLS may reveal overall motor control abilities and provide early warning signs of central nervous system failure (Quarmby et al., 2022). It may also be a good index for evaluating performance after injuries from sports or strokes (Perez-Cruzado et al., 2018).
To date, these three commonly-used stance tests, which are assessed by the total time a stance can be held, have not reliably shown enough sensitivity (0.33) and specificity (0.71) to predict recurrent or future falls in older adults (Omaña et al., 2021). Therefore, this type of clinical balance ability test should be evaluated in combination with other data such as surface electromyography (sEMG) (Norcross et al., 2010; Hirono et al., 2020). Measuring muscle activity data such as the simultaneous co-contraction of agonist and antagonist muscles as well as synergistic muscle EMG data, the total firing magnitude of a muscle, and their magnitude similarity during SLS is also a good quantitative indicator of postural stability (Iwamoto et al., 2017). Surface EMG data magnitude comparison between participants has been a difficult task. Surface EMG shows significant inter-individual differences depending on the level of muscle development (Halaki and Ginn, 2012). Thus, normalization of the magnitude measured by EMG is necessary for direct comparison. Normalizing with maximum voluntary isometric contraction can accumulate additional errors, which has been a long-standing issue for researchers using sEMG (Burden, 2010). The issue could be solved by using similarity index and magnitude of the Brain Motor Control Assessment (BMCA) (McKay et al., 2004). BMCA is a functional electromyography (fEMG) method that utilizes multi-surface EMG. It records electrical activity from multiple muscles related with the motion using sEMG electrodes during standardized tasks (Lim et al., 2004). BMCA aims to characterize the function and behavior of the upper motor neurons, particularly in individuals with motor impairments such as those resulting from spinal cord injuries or strokes (Hong et al., 2018). Additionally, BMCA can also be applied for comparisons between healthy control groups, healthy test groups, and patient groups. These groups may differ in age and gender, serving various research and clinical purposes (Nicolelis et al., 2022).
In this study, we recorded sEMG for 6 muscles in each leg during three stance tests (DLS, TS, and R-SLS/L-SLS) and evaluated the simultaneous muscle activity patterns during the stances using SI.
2.1 Participants
All participants signed consent forms before participating in this study (IRB no. DHCIRB-2022-06-0008). A total of 22 neurologically intact participants (3 males and 19 females with an average age of 70.3±4.2 years, an average weight of 62.2±6.6kg, and an average height of 156.8±6.4cm) were asked to follow the standard protocol for the leg stance tests as described by the Korean Balance Ability Data Center. None of the participants had a previous history of falls, difficulty walk, or a fear of falls, diseases affecting balance, difficulty walk, or a fear of falling. In the U.S. CDC (Center for Disease Control and Prevention), it was reported that there was no problem with balance when an elderly person could perform DLS, TS, and SLS for at least 10 seconds (Nithman and Vincenzo, 2019). Based on this, in this study, we divided healthy elderly people into two groups: those who performed all standing balance skills for more than 10 seconds and those who performed all standing balance skills for less than 10 seconds. Of the 22 subjects, only 15 demonstrated a duration of longer than 10 seconds across all stances (DLS, TS, and SLS). These 15 subjects were designated as the prototype response vector (control group), while the remaining 7 subjects constituted the test group.
2.2 Measuring stance time and sEMG
Stance time was measured with a video recording instead of a stopwatch. Every test was recorded using a synchronized reference video camera (NiNOX 120). For the entire stance time analysis, the starting time was set to two frames after the moment that the foot left the floor as determined using the video file (60 FPS) from the camera. The end time was two frames before the moment that the foot was touching on the floor. The participants completed three trials for each stance, and the average time was used in the analysis. A total of 12 multi-sEMG electrodes were attached to both legs for the balance tests (DLS, TS and right/left SLS). The wireless sEMG recording system (Ultium EMG sensor system, Noraxon USA) was used with a bandwidth of 10~500Hz and a 2,000Hz sampling rate. sEMG recordings were made for six muscles in each leg: rectus femoris, tibialis anterior, peroneus, biceps femoris, lateral gastrocnemius, and soleus. The tests were repeated three times, and the average sEMG values were used in the analysis.
2.3 Brain motor control assessment (BMCA) protocol: Similarity index and magnitude calculations
We made prototype sEMG vectors using sEMG data from 15 participants who could hold all of the stances for more than 10 seconds. These participants became the control group based on brain motor control assessment (BMCA) which was used to evaluate the residual motor control ability of spinal cord injured patients out of healthy participants using surface EMG (Lim and Sherwood, 2005). sEMG data from the other participants (Pt1-Pt7) in this study, who were unable to hold any stance for 10 seconds, were used as the test group. The sEMG activity of these seven participants was compared to the prototype vectors. The prototype response vectors (PRV) were generated from the sEMG patterns from 15 participants in control group. The sEMG was recorded for up to 30 seconds for SLS for each participant. We normalized the integrated sEMG data using the sampling rate, and the multi-sEMG patterns were compared for the three different stances. Muscle activity was divided by total sEMG integration; these normalized and averaged values per muscle are called prototype response vectors (which have 12 components). Finally, the SI was calculated for each participant using the inner product of two vectors. BMCA results were plotted using X (magnitude) and Y (SI) for each participant. An SI value greater than 0.9 indicates an excellent correlation between two groups, 0.8 to 0.89 indicates a good correlation, 0.7 to 0.79 indicates a moderate correlation, and less than 0.7 indicates a weak correlation (Lim and Sherwood, 2005; Schober et al., 2018). The procedure for calculating BMCA is attached as an appendix at the end of this paper, with an Excel code for each value (including SI and magnitude). SPSS 27 software was used for data analysis.
3.1 SLS, TS, and DLS maintenance times
The anthropometric data of the participants (age, weight, height, and foot size) are summarized in Table 1 along with the time of each test in seconds. All participants in the control group were able to hold the DLS for 30 seconds. The average time decreased slightly to 29.7(±0.7) seconds for TS, 28.1(±3.5) seconds for R-SLS and 26.5(±5.0) seconds for L-SLS. In contrast, participants in the test group showed decreased times for all stances except double leg stance. The average stance time for DLS was 30.0(±0.0) seconds and 17.3(±9.6) seconds for TS. Maintenance time was 8.9(±4.6) seconds for R-SLS and 12.2(±9.7) seconds for L-SLS (Table 1). The times of the test group for each stance are also summarized in Table 2.
|
Groups |
Anthropometric data |
Duration |
|||||||
|
AGE |
Weight (kg) |
Height (cm) |
Foot size |
DLS (s) |
TS (s) |
R-SLS (s) |
L-SLS (s) |
||
|
Control
group (n=15) |
AVE |
69.9 |
62.7 |
156.2 |
238.0 |
30.0 |
29.7 |
28.1 |
26.5 |
|
SD |
3.9 |
4.5 |
4.8 |
5.3 |
0.0 |
0.7 |
3.5 |
5.0 |
|
|
Test
group (n=7) |
AVE |
71.9 |
61.3 |
163.0 |
243.6 |
30.0 |
17.3 |
8.9 |
12.2 |
|
SD |
4.5 |
10.2 |
0.0 |
14.4 |
0.0 |
9.6 |
4.6 |
9.7 |
|
|
Participant in the test group (Pt) |
DLS |
TS |
RSLS |
LSLS |
|
Pt1 |
30.0 |
14.2 |
5.4 |
5.2 |
|
Pt2 |
30.0 |
10.6 |
16.0 |
7.3 |
|
Pt3 |
30.0 |
23.6 |
6.4 |
27.3 |
|
Pt4 |
30.0 |
11.0 |
7.0 |
5.0 |
|
Pt5 |
30.0 |
4.8 |
4.0 |
4.2 |
|
Pt6 |
30.0 |
27.1 |
9.37 |
12.3 |
|
Pt7 |
30.0 |
30.0 |
14.5 |
24.3 |
3.2 SLS, TS, and DLS sEMG activity
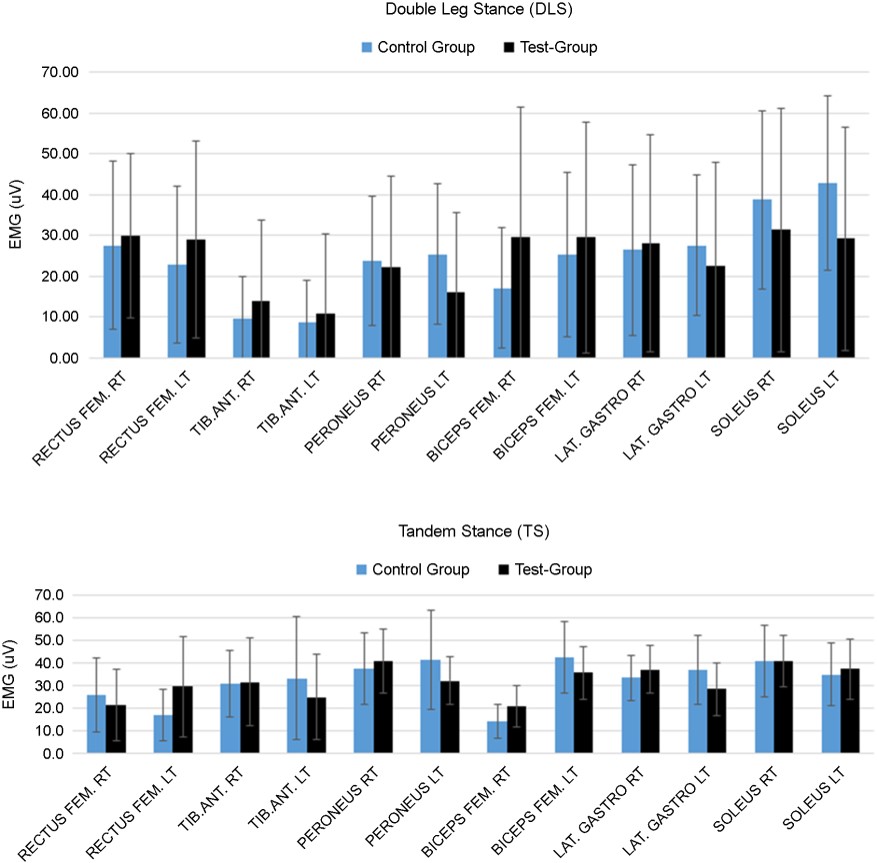
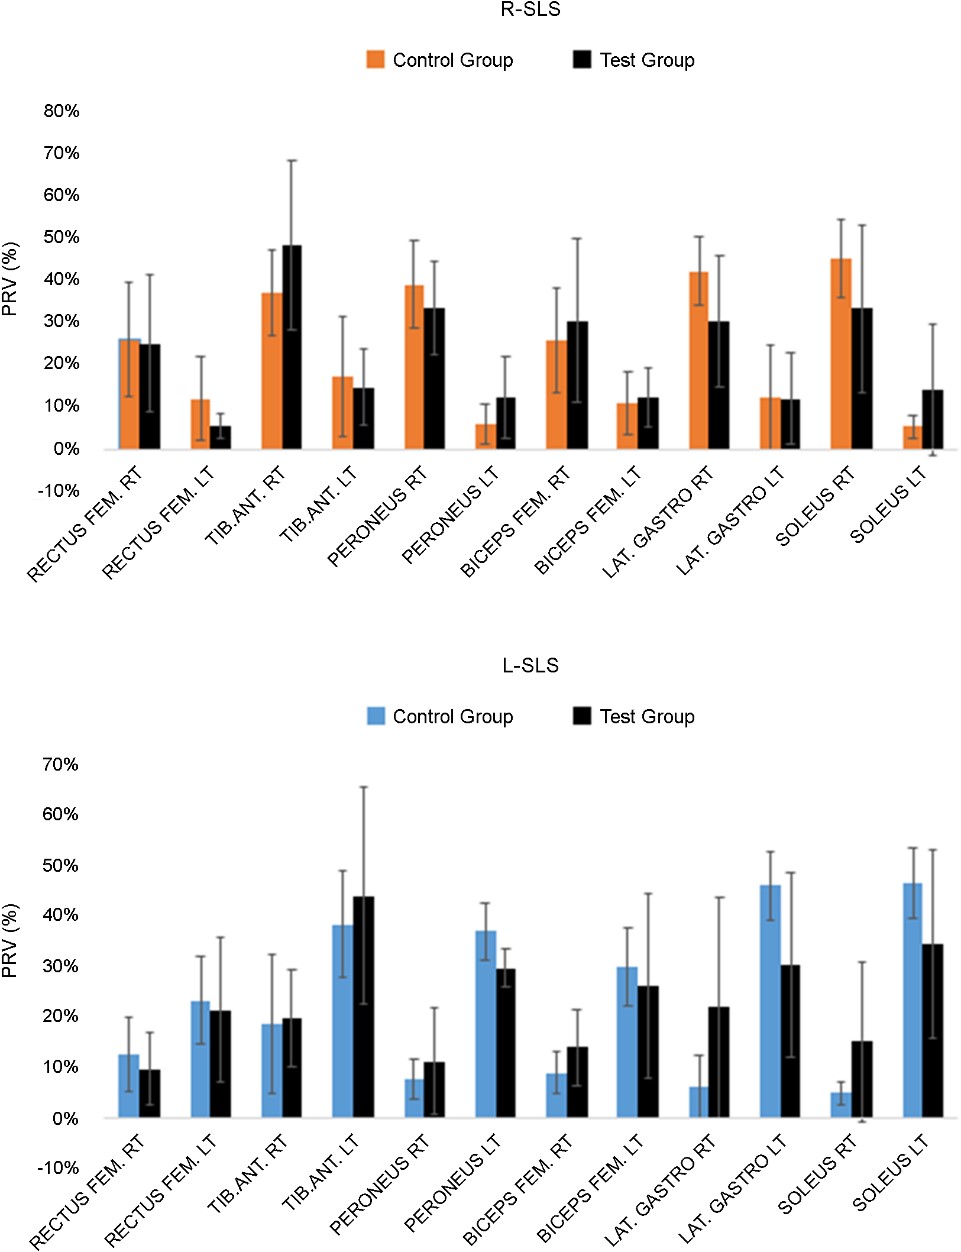
During DLS, sEMG activity ranged from 1.0 to 72uV for 12 muscles (Figure 1). Left and right muscles at the same position on each side showed similar muscle activity (p > 0.4) (average muscle activity=24.6±19.2uV). During TS, sEMG activity was observed (average muscle activity=31.4±18.7uV). R-SLS showed much greater sEMG activity (47.3±29.2uV) for the muscles on the right side than the left side (14.2±12.9uV) (Figure 2). By contrast, L-SLS showed much greater sEMG activity (47.7±22.8uV) for muscles on the left side than the right side (14.7±12.0uV). The tibialis anterior muscle showed the greatest sEMG activity during SLS: 56.4(±43.7)uV for R-SLS and 56.2(±37.1)uV for L-SLS.
3.3 BMCA protocol (SI and Magnitude) during DLS, TS, and R/L-SLS
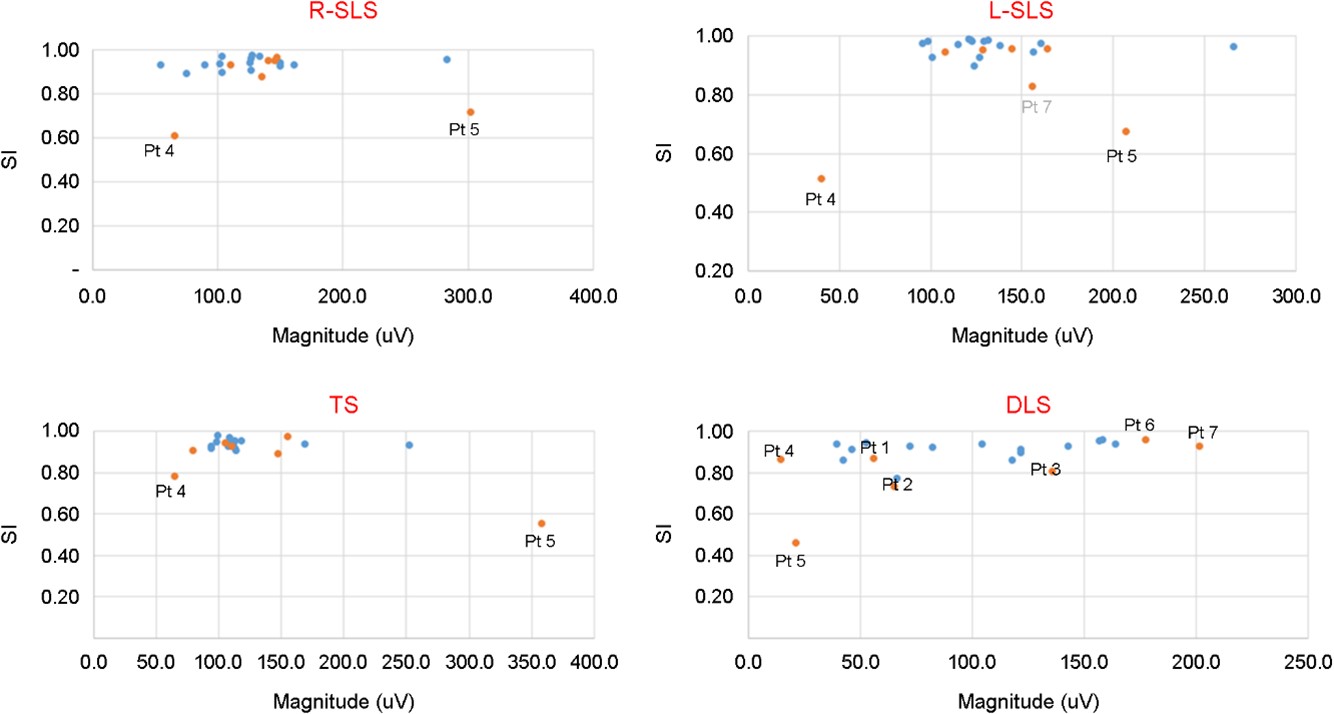
The measured BMCA protocol SI results for DLS were higher than 0.8 for most of the participants, with the exception of two participants (Pt2 and Pt5) in the control group who had an SI under 0.8. The magnitudes ranged from 14.6~201uV. For TS, all participants had SI values greater than 0.9 with magnitudes ranging from 79.4~252uV. All participants had SI values over 0.9 for R-SLS, except for Pt4 (SI=0.55) and Pt5 (SI=0.67), with magnitudes ranging from 50.4~302.3uV. All participants showed SI values over 0.9 for L-SLS, except for Pt4 (SI=0.58) and Pt5 (0.68), with magnitudes ranging from 40.3~265.7uV. SI and magnitude values for all stances are displayed in Figure 3.
In this study, we tested the stability of older adults (n=22, average age=70.3±4.2 years) using three different tests: the double-leg stance, tandem stance, and right and left single-leg stance. For each stance, we measured and analyzed stance time, sEMG activity, SI, and magnitude.
Some older adults are at high risk of falling and need an appropriate tool to evaluate and anticipate the likelihood of future falls. One-third of older adults will fall each year, and half of that group will fall more than two times a year. Recurrent falls (two or more falls/year) in older adults represent a significant functional decline in muscle control mechanisms and are associated with high levels of mortality (Jehu et al., 2021).
Suggested predictors of falls have included the maximum step length (meters), rapid step (seconds), timed up and go (seconds), 6-minute walk (feet), tandem walk (error number), maximum step length (inches), unipedal stance (seconds), and tandem stance (seconds) tests, along with the performance-oriented mobility assessment (number) (Cho et al., 2004). Timed up and go is strongly associated with a past history of falls, but its predictive ability is limited (Beauchet et al., 2011). The 6-minute walk showed a moderate association between falls and the likelihood of having a stroke (Regan et al., 2020). SLS tests are often described as a strong candidate to predict the fall risk of older adults but have not shown clear evidence of diagnostic accuracy (Omaña et al., 2011). While we cannot summarize all the controversial debates on the evaluation tools discussed here, because of the multiple characteristics of falls (increased risk factors including chronic condition, muscle & bone weakness and weakened balance issues), it is clear that a combination of assessment tools is needed to better understand falls in older adults (Park, 2018; Rubenstein, 2006) for the weakened muscle and balance issue. One absolutely clear relationship is that more than two falls per year in older adults is highly correlated with weak and inappropriate motor function. Therefore, we need to see their electromyographic muscle activity in addition to the maintenance time that they can hold the stances (Rubega et al., 2021). EMG and other multimodal fusion sensors (a type of artificial intelligence) may even become the next solution for predictions (Katmah et al., 2023).
As shown in the results section of this study, the standard deviations of all muscles are notably large. Most of muscle activities (EMG values) in healthy individuals exhibit considerable inter-individual variation, regardless of muscle location. EMG values differ significantly based on individual factors such as body shape, age, and gender. This variability highlights the strength of BMCA as a tool for comparing individuals, as it simultaneously analyzes multi-muscle activities without the need for normalization using maximum voluntary contraction.
Electromyographic measurements, including timing, magnitude, variability of activation, and co-contraction indices, are used to reveal the functional differences between younger and older adults in terms of their walking and balance perturbations (Kim and Chou, 2022). In electrophysiological exams, falls were significantly associated with peripheral neuropathy (Richardson et al., 1992) and EMG co-contraction between agonist and antagonist muscles (Annese and De Venuto, 2015). Older adults showed different muscle activations in lower limbs for balance, especially for the co-contraction of the lower limb muscles. In summary, muscle coordination between agonist and antagonist muscles is the key to explaining balance. Falling and stability are also related to muscle fatigue (Helbostad et al., 2010) and the center of pressure path length, velocity, and sway (Pizzigalli et al., 2016). In this study, we used conventional stability tests such as double-leg stance, tandem stance, and the single-leg stance tests to measure stance time in combination with electromyography from 12 muscles. Even though several participants had short stance times for the single leg stance (under 10 seconds), only two participants had smaller SI values for TS, R-SLS, and L-SLS consistently.
We do not guarantee that SI is a reliable and useful predictor of falls yet. The similarity index of BMCA, however, is known as a useful tool that has been used for a variety of purposes: comparing voluntary motor control patterns between healthy groups and groups with spinal cord injuries (McKay et al., 2004), hyperkyphosis (in older adults) (Veiskarami et al., 2022), or cerebral palsy (Balzer et al., 2022), rehabilitating athletes with shoulder disorders (Hajouj et al., 2021), creating different training plans for cruciate ligament deficiency (Jomhouri et al., 2021), and comparing gait patterns in people with/without nonspecific chronic neck pain (Lee and Sung, 2022). Maintenance time is a scalar information and does not explain how each muscle is involved to maintain the center of body. Multiple EMG is a good choice for adding information how lower muscles are working together as a vector information.
4.1 Limitations of the study
The total number of participants in this study were relatively small. However, drawing on our previous studies using the BMCA protocol, we believe that the results (including the SI and magnitude values for the healthy individuals) would not change significantly if a larger number of subjects were recruited, despite the limited number of subjects included in this study based on the total number of healthy participants for making the prototype vector in the previous BMCA studies.
In this study, we applied the BMCA protocol to examine whether the sEMG patterns of healthy older adults demonstrate consistent and similar activity during various standing tests. The results suggest that the similarity index shows potential as an effective screening tool for identifying older adults who may face difficulties in maintaining optimal stability. Furthermore, the BMCA protocol could be a valuable method for monitoring the serial motor control abilities of the senior population across different stability tests.
References
1. Ambrose, A.F., Paul, G. and Hausdorff, J.M., Risk factors for falls among older adults: a review of the literature, Maturitas, 75(1), 51-61, 2013.
Google Scholar
2. Annese, V.F. and De Venuto, D., Fall-risk assessment by combined movement related potentials and co-contraction index monitoring. Proc. 2015 IEEE Biomedical Circuits and Systems Conference (BioCAS), 1-4, 2015.
Google Scholar
3. Beauchet, O., Fantino, B., Allali, G., Muir, S., Montero-Odasso, M. and Annweiler, C., Timed Up and Go test and risk of falls in older adults: a systematic review, The Journal of Nutrition, Health & Aging, 15(10), 933-938, 2011.
Google Scholar
4. Burden, A., How should we normalize electromyograms obtained from healthy participants? What we have learned from over 25 years of research, Journal of Electromyography and Kinesiology, 20(6), 1023-1035, 2010.
Google Scholar
5. Chaudhry, H., Findley, T., Quigley, K.S., Ji, Z., Maney, M., Sims T., Bukiet, B. and Foulds, R., Postural stability index is a more valid measure of stability than equilibrium score, Journal of Rehabilitation Research and Development, 42(4), 547-556, 2005.
Google Scholar
6. Cho, B.L., Scarpace, D. and Alexander, N.B., Tests of stepping as indicators of mobility, balance, and fall risk in balance-impaired older adults, Journal of the American Geriatrics Society, 52(7), 1168-1173, 2004.
Google Scholar
7. Hajouj, E., Hadian, M.R., Mir, S.M., Talebian, S. and Ghazi, S., Motor control changes after innovative aquatic proprioceptive training in athletes with anterior cruciate ligament reconstruction: Voluntary response index analysis, Archives of Neuroscience, 8(2), 2021.
Google Scholar
8. Halaki, M. and Ginn, K., Normalization of EMG signals: to normalize or not to normalize and what to normalize to, Computational intelligence in electromyography analysis-a perspective on current applications and future challenges, 10(49957), 2012.
Google Scholar
9. Helbostad, J.L., Sturnieks, D.L., Menant, J., Delbaere, K., Lord, S.R. and Pijnappels, M., Consequences of lower extremity and trunk muscle fatigue on balance and functional tasks in older people: a systematic literature review, BMC Geriatrics, 10(1), 1-8, 2010.
Google Scholar
10. Hirono, T., Ikezoe, T., Taniguchi, M., Yamagata, M., Miyakoshi, K., Umehara, J. and Ichihashi, N., Relationship between ankle plantar flexor force steadiness and postural stability on stable and unstable platforms, European Journal of Applied Physiology, 120(5), 1075-1082, 2020.
Google Scholar
11. Hong, M.J., Park, J.B., Lee, Y.J., Kim, H.T., Lee, W.C., Hwang, C.M., Lim, H.K. and Lee, D.H., Quantitative evaluation of post-stroke spasticity using neurophysiological and radiological tools: a pilot study, Annals of Rehabilitation Medicine, 42(3), 384-395, 2018.
Google Scholar
12. Iwamoto, Y., Takahashi, M. and Shinkoda, K., Muscle co-contraction in elderly people change due to postural stability during single-leg standing, Journal of Physiological Anthropology, 36(1), 43, 2017.
Google Scholar
13. Jehu, D., Davis, J., Falck, R., Bennett, K., Tai, D., Souza, M.F., Cavalcante, B.R., Zhao, M. and Liu-Ambrose, T., Risk factors for recurrent falls in older adults: A systematic review with meta-analysis, Maturitas, 144, 23-28, 2021.
Google Scholar
14. Jomhouri, S., Talebian, S., Vaez-Mousavi, M., Hatef, B. and Sadjadi-Hazaveh, S., Changes in the trend of walking motor control in athletes with anterior cruciate ligament deficiency in response to progressive perturbation trainings, Austin Sports Medicine, 6(1), 1045, 2021.
Google Scholar
15. Katmah, R., Al Shehhi, A., Jelinek, H.F., Hulleck, A.A. and Khalaf, K., A Systematic Review of Gait Analysis in the Context of Multimodal Sensing Fusion and AI, IEEE Transactions on Neural Systems and Rehabilitation Engineering, 2023.
Google Scholar
16. Kim, H.K. and Chou, L.S., Lower limb muscle activation in response to balance-perturbed tasks during walking in older adults: A systematic review, Gait & Posture, 93, 166-176, 2022.
Google Scholar
17. Lee, D. and Sung, P.S., Comparison of kinematic similarity index during gait between adults with and without nonspecific chronic neck pain, Gait & Posture, 91, 99-104, 2022.
Google Scholar
18. Lim, H.K. and Sherwood, A.M., Reliability of surface electromyographic measurements from subjects with spinal cord injury during voluntary motor tasks, Journal of Rehabilitation Research and Development, 42(4), 413-422, 2005.
Google Scholar
19. Lim, H.K., Lee, D.C., Mckay, W.B., Protas, E.J., Holmes, S.A., Priebe, M.M. and Sherwood, A., Analysis of sEMG during voluntary movement--Part II: Voluntary response index sensitivity, IEEE Transactions on Neural Systems and Rehabilitation Engineering, 12(4), 416-421, 2004.
Google Scholar
20. Mckay, W., Lim, H., Priebe, M., Stokic, D. and Sherwood, A., Clinical neurophysiological assessment of residual motor control in post-spinal cord injury paralysis, Neurorehabilitation and Neural Repair, 18(3), 144-153, 2004.
Google Scholar
21. Nicolelis, M.A., Alho, E.J., Donati, A.R., Yonamine, S., Aratanha, M.A., Bao, G., Campos, D.S., Fischer, D. and Shokur, S., Training with noninvasive brain-machine interface, tactile feedback, and locomotion to enhance neurological recovery in individuals with complete paraplegia: a randomized pilot study, Sabrina Almeida, Scientific Reports, 12(1), 2022, DOI:10.1038/s41598-022-24864-5.
Google Scholar
22. Nithman, R.W. and Vincenzo, J.L., How steady is the STEADI? Inferential analysis of the CDC fall risk toolkit, Archives of Gerontology and Geriatrics, 83, 185-194, 2019.
Google Scholar
23. Norcross, M.F., Blackburn, J.T. and Goerger, B.M., Reliability and interpretation of single leg stance and maximum voluntary isometric contraction methods of electromyography normalization, Journal of Electromyography and Kinesiology, 20(3), 420-425, 2010.
Google Scholar
24. Omaña, H., Bezaire, K., Brady, K., Davies, J., Louwagie, N., Power S., Santin, S. and Hunter, S.W., Functional reach test, single-leg stance test, and tinetti performance-oriented mobility assessment for the prediction of falls in older adults: a systematic review, Physical Therapy, 101(10), pzab173, 2021.
Google Scholar
25. Park, S.H., Tools for assessing fall risk in the elderly: a systematic review and meta-analysis, Aging Clinical and Experimental Research, 30(1), 1-16, 2018.
Google Scholar
26. Perez-Cruzado, D., Gonzalez-Sanchez, M. and Cuesta-Vargas, A.I., Differences in Kinematic Variables in Single-Leg Stance between Patients with Stroke and Healthy Elderly People Measured with Inertial Sensors: A Cross-Sectional Study, Journal of Stroke and Cerebrovascular Diseases, 27(1), 229-239, 2018.
Google Scholar
27. Pizzigalli, L., Micheletti Cremasco, M., Mulasso, A. and Rainoldi, A., The contribution of postural balance analysis in older adult fallers: A narrative review, Journal of Bodywork and Movement Therapies, 20(2), 409-417, 2016.
Google Scholar
28. Quarmby, A., Monnig, J., Mugele, H., Henschke, J., Kim, M., Cassel, M. and Engel, T., Biomechanics and lower limb function are altered in athletes and runners with achilles tendinopathy compared with healthy controls: A systematic review, Front Sports Act Living, 4, 2022, DOI:10.3389/fspor.2022.1012471.
Google Scholar
29. Regan, E., Middleton, A., Stewart, J.C., Wilcox, S., Pearson, J.L. and Fritz, S., The six-minute walk test as a fall risk screening tool in community programs for persons with stroke: a cross-sectional analysis, Topics in Stroke Rehabilitation, 27(2), 118-126, 2020.
Google Scholar
30. Richardson, J.K., Ching, C. and Hurvitz, E.A., The relationship between electromyographically documented peripheral neuropatny and falls, Journal of the American Geriatrics Society, 40(10), 1008-1012, 1992.
Google Scholar
31. Rubega, M., Di Marco, R., Zampini, M., Formaggio, E., Menegatti, E., Bonato P., Masiero, S. and Felice, A.D., Muscular and cortical activation during dynamic and static balance in the elderly: A scoping review, Aging Brain, 1, 2021, DOI:10.1016/j.nbas.2021.100013.
Google Scholar
32. Rubenstein, L.Z., Falls in older people: epidemiology, risk factors and strategies for prevention, Age and Ageing, 35(suppl_2), ii37-ii41, 2006.
Google Scholar
33. Schober, P., Boer, C. and Schwarte, L.A., Correlation coefficients: appropriate use and interpretation, Anesthesia & Analgesia, 126(5), 1763-1768, 2018.
Google Scholar
34. Shumway-Cook, A., Baldwin, M., Polissar, N.L. and Gruber, W., Predicting the probability for falls in community-dwelling older adults, Physical Therapy, 77(8), 812-819, 1997.
Google Scholar
35. Veiskarami, M., Gholami, M., Aboutorabi, A. and Khamesi, E., Explaining the experiences of health care providers regarding organizational factors affecting health education: a qualitative study, Journal of Modern Rehabilitation, 2022.
Google Scholar
36. Williams, R.M., Corvo, M.A., Lam, K.C., Williams, T.A., Gilmer, L.K. and Mcleod, T.C.V., Test-retest reliability and practice effects of the stability evaluation test, Journal of Sport Rehabilitation, 26(3), 2017.
Google Scholar
37. Balzer, J., Fahr, A., Keller, J.W., Van Der Linden, M.L., Mercer, T.H. and Van Hedel, H.J., Validity and reliability of an electromyography-based similarity index to quantify lower extremity selective voluntary motor control in children with cerebral palsy, Clinical Neurophysiology Practice, 7, 107-114, 2022.
Google Scholar
PIDS App ServiceClick here!