eISSN: 2093-8462 http://jesk.or.kr
Open Access, Peer-reviewed
eISSN: 2093-8462 http://jesk.or.kr
Open Access, Peer-reviewed
Xiaopeng Yang
, Hee Chul Yu
, Younggeun Choi
, Jae Do Yang
, Baik Hwan Cho
, Heecheon You
10.5143/JESK.2017.36.1.37 Epub 2017 March 02
Abstract
Objective: The present study developed a user-centered 3D virtual liver surgery planning (VLSP) system called Dr. Liver to provide preoperative information for safe and rational surgery.
Background: Preoperative 3D VLSP is needed for patients' safety in liver surgery. Existing systems either do not provide functions specialized for liver surgery planning or do not provide functions for cross-check of the accuracy of analysis results.
Method: Use scenarios of Dr. Liver were developed through literature review, benchmarking, and interviews with surgeons. User interfaces of Dr. Liver with various user-friendly features (e.g., context-sensitive hotkey menu and 3D view navigation box) was designed. Novel image processing algorithms (e.g., hybrid semi-automatic algorithm for liver extraction and customized region growing algorithm for vessel extraction) were developed for accurate and efficient liver surgery planning. Usability problems of a preliminary version of Dr. Liver were identified by surgeons and system developers and then design changes were made to resolve the identified usability problems.
Results: A usability testing showed that the revised version of Dr. Liver achieved a high level of satisfaction (6.1 ± 0.8 out of 7) and an acceptable time efficiency (26.7 ± 0.9 min) in liver surgery planning.
Conclusion: Involvement of usability testing in system development process from the beginning is useful to identify potential usability problems to improve for shortening system development period and cost.
Application: The development and evaluation process of Dr. Liver in this study can be referred in designing a user-centered system.
Keywords
Virtual liver surgery planning system User-Centered system design Usability testing
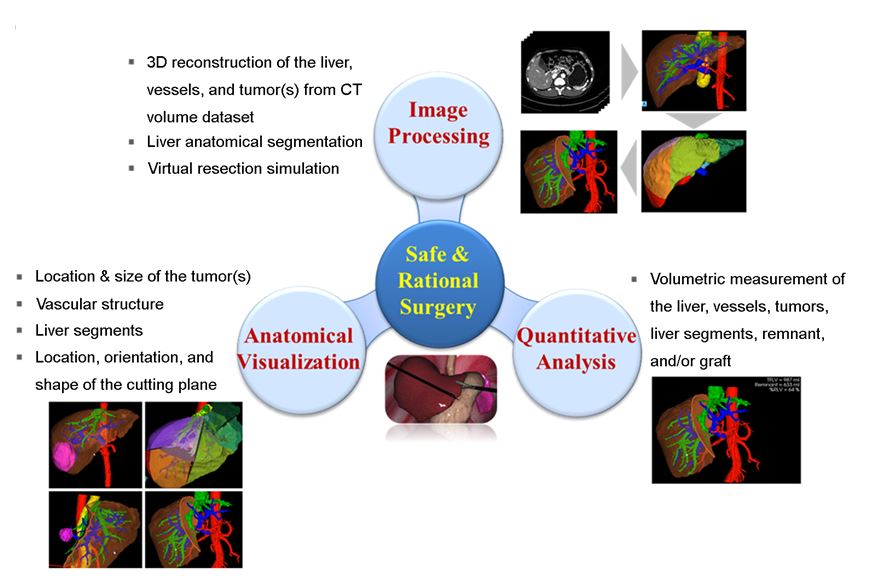
A 3D virtual liver surgery planning (VLSP) system can provide surgeons with an effective tool for safe, rational liver surgeries such as living donor liver transplantation (LDLT) and tumor resection. The safety of hepatectomy can be predicted by relative residual liver volume (%RLV = ratio of residual to total functional liver volume). Schindl et al. (2005) identified that serious postoperative hepatic dysfunction occurs if %RLV < 26.6% based on an ROC analysis on 104 patients with normal synthetic liver function. Ferrero et al. (2007) reported based on an analysis of 119 cases that hepatectomy can be considered safe if %RLV > 26.5% for patients with healthy liver and %RLV >31% for those with impaired liver function. A rational liver surgery can be planned by analyzing the structures of the three liver vascular trees (portal vein, hepatic vein, and hepatic artery) in LDLT and the spatial relationship between a tumor(s) and the vascular trees in tumor resection. As shown in Figure 1, a 3D VLSP system needs to provide not only visual information for the location and size of a tumor(s), the liver vascular trees, the anatomical segments of the liver, and the location, orientation, and shape of a resection plane, but also quantitative information of the volumes of the liver, vessels, tumor(s), liver segments, remnant, and/or graft (Debarba et al., 2010; Reitinger et al., 2006; Sorantin et al., 2008).
Commercialized systems including generic 3D virtual surgery systems and specialized systems to liver surgery planning are available in the market. Generic 3D virtual surgery systems do not provide functions specialized to liver surgery planning and thus their utility is limited in clinical environments in terms of time and functionality. Examples of generic 3D virtual surgery systems include Rapidia (Infinitt Co., Ltd, South Korea), Voxar 3D (Toshiba Co., Japan), syngo.via (Siemens Co., Germany), and OsiriX (Pixmeo Co., Switzerland). Use of manual or semi-automatic methods in a generic virtual surgery system for 3D liver reconstruction from computed tomography (CT) images is cumbersome and time demanding (> 30min). Furthermore, functions of liver anatomical segmentation and liver surgery planning are not provided in a generic virtual surgery system. Several specialized systems to liver surgery planning such as Liver Analyzer (MeVis Medical Solutions AG, Germany) and SYNAPASE VINCENT (Fujifilm Co., Japan) have been developed. Liver Analyzer is not for sale, but is known to have capabilities of (1) 3D reconstruction of the liver, vessels, biliary system, and tumors, (2) volumetric measurement of the liver, tumors, remnant, and/or graft, (3) evaluation of vascular territories, and (4) liver surgery planning. Only a distant web service is available for Liver Analyzer—CT images are sent to MeVis and analyzed by Liver Analyzer and then a liver analysis report is delivered within one or two days depending on the selected payment option. The liver analysis report is viewed by Liver Viewer (provided free of charge by MeVis), which only shows 3D analysis results without presenting overlaid CT images and therefore surgeons have difficulty in cross-check of the accuracy of analysis results. In contrast, providing functionalities similar to Liver Analyzer, Synapse Vincent is on sale.
Previous studies of liver surgery planning system development focused on exploring image processing algorithms and their performance in terms of accuracy and time efficiency without considering usability. Reitinger et al. (2006) developed a liver surgery planning system incorporating virtual reality technology consisting of three stages: (1) liver and tumor segmentation and vessel extraction, (2) segmented liver refinement, and (3) anatomical liver segmentation and virtual resection. The virtual reality-based virtual resection method was evaluated in terms of time efficiency and found that an average of 23.3 min per case was needed for surgery planning. Next, Shevchenko et al. (2010) proposed a planning system for liver surgery by segmentation of the liver, vessels, and tumors using automatic and semi-automatic segmentation techniques, not including a virtual resection function. They evaluated the segmentation performance of their system in terms of accuracy (average surface discrepancy = 4.0mm compared to manual segmentation) and time efficiency (average segmentation time = 14min per case). Lastly, Chen et al. (2013) developed a system consisting of liver segmentation, vessel extraction, and visualization and interaction of a liver model for virtual resection. They conducted a simple survey with two surgeons about their subjective satisfaction of their system in terms of visualization, operation, reality, and practicality by collecting simple answers such as "good", "easy", "not good", "yes" or "no", which might not be sufficient enough to identify potential usability problems.
The present study is aimed to develop a user-centered 3D virtual liver surgery planning system called Dr. Liver which provides intuitive and user-friendly interfaces and advanced image processing algorithms to assist surgeons in preoperative planning of liver surgeries within a reasonable time (< 30min). A comprehensive and systematic usability testing using a customized evaluation metric system developed in the present study was conducted to identify potential usability problems of Dr. Liver and improvements were made for the identified problems.
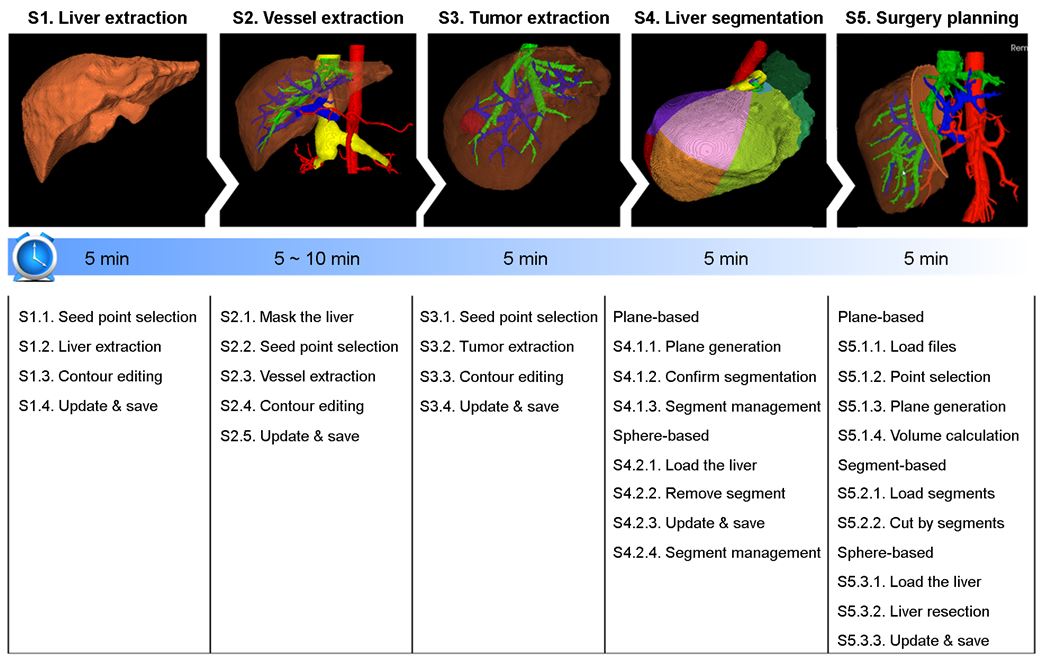
2.1 Developing use scenarios
A use scenario consisting of a five-step procedure (see Figure 2): (1) liver 3D reconstruction, (2) vessel 3D reconstruction, (3) tumor 3D reconstruction, (4) liver anatomical segmentation, and (5) surgery planning was developed for Dr. Liver through literature review, benchmarking of existing systems, and interviews with surgeons. Reitinger et al. (2006) proposed a system for liver surgery planning using virtual reality technology composed of three stages: (1) liver and tumor segmentation, and vessel extraction, (2) segmentation refinement, and (3) liver anatomical segmentation and virtual resection. Chen et al. (2013) developed a system consisting of liver segmentation, vessel extraction, and visualization and interaction of liver models for virtual resection. Commercialized systems including Liver Analyzer (MeVis Medical Solutions AG, Germany) and Synapse Vincent (Fujifilm Co., Japan) provide functions of (1) 3D reconstruction and volumetric measurement of the liver, vessels, biliary system, and tumors, (2) liver anatomical segmentation based on evaluation of vascular territories, and (3) liver surgery planning. A survey of liver surgeons identified that 3D modeling of the liver, vessels, and tumors, anatomical classification of liver segments based on vascular territories, and virtual resection of the liver are needed for preoperative liver surgery planning. Based on the results of literature review, benchmarking, and interview, detailed sub-steps were prepared and then advanced image processing algorithms were implemented to obtain results with an acceptable level of accuracy and time efficiency. Dr. Liver was designed to provide good usability, accuracy, and time efficiency (< 30min) from liver 3D reconstruction to surgery planning. The international standard ISO 9241-11 (1998) states that usability of a product is the extent to which the product can be used by specified users to achieve specified goals with effectiveness, efficiency, and satisfaction in a specified context of use. Nielsen (1993) proposed that usability of a product consists of multiple attributes including (1) learnability, (2) efficiency of use, (3) memorability, (4) error rate, and (5) subjective satisfaction.
2.2 Designing user interfaces
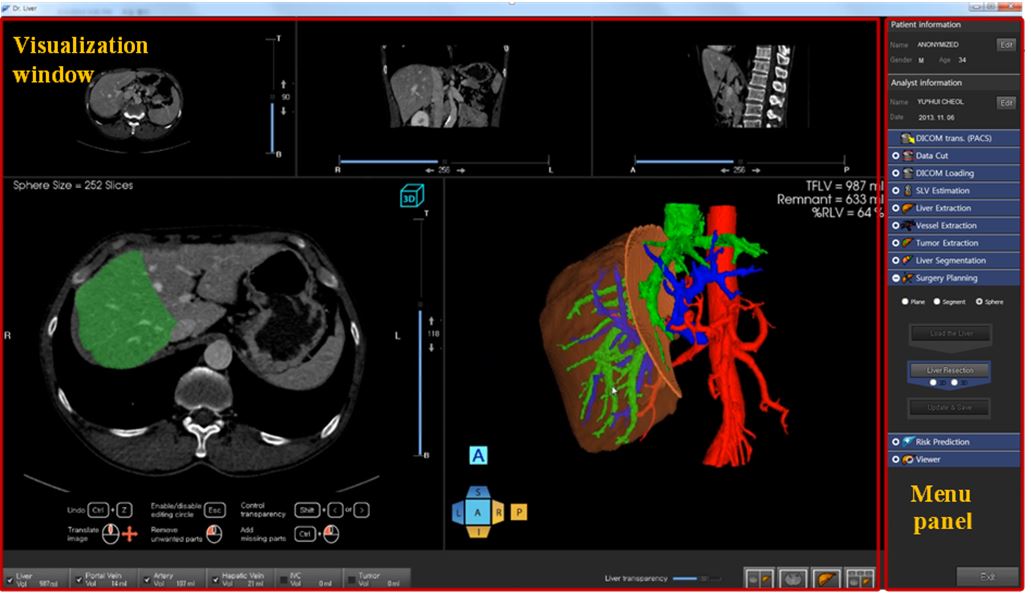
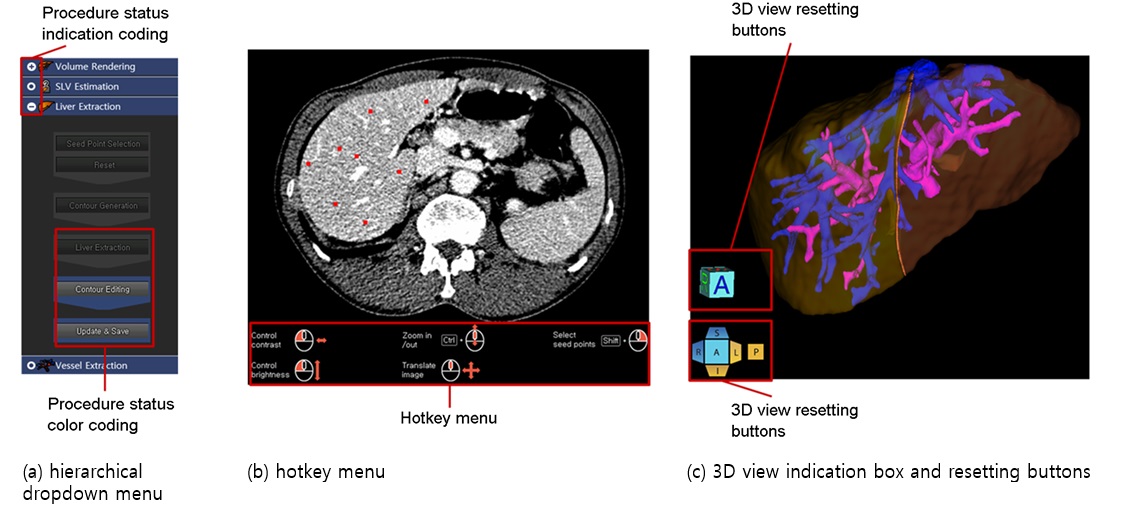
User-friendly interfaces consisting of visualization and menu windows (Figure 3) were designed for Dr. Liver to provide surgeons with good usability. Based on the use scenario of Dr. Liver, a hierarchical menu with two task levels was designed as illustrated in Figure 4.a. The design of button size, color and font size, color is kept consistent for the same hierarchical level. For high-level tasks, a procedure status indication coding scheme (circle: not conducted; bar in the circle: in progress; cross in the circle: completed) is employed; for low-level tasks, a procedure status color coding scheme (grey: completed or not conducted; blue: in progress) is applied. Hotkey menus (Figure 4.b) were provided on the screen of Dr. Liver to reduce the user's cognitive workload for memory. A 3D view indication box and resetting buttons (Figure 4.c) were provided so that users can easily navigate views in 3D. User interfaces of the five modules from liver extraction to surgery planning were designed to allow users to selectively perform tasks for liver surgery planning in a sequential manner according to surgery needs in their context of use.
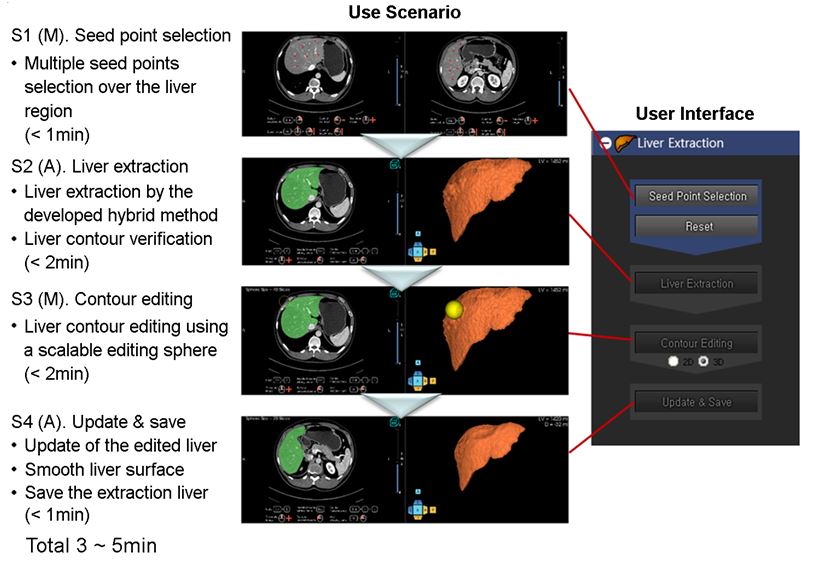
2.2.1 Liver 3D reconstruction module
The liver is reconstructed from abdominal CT images by our proposed hybrid semi-automatic method (Yang et al., 2014) consisting of five steps: (1) denoising of CT images by an anisotropic diffusion filter (Perona and Malik, 1990), (2) selection of multiple seed points, (3) formation of initial liver regions by a customized fast-marching level-set method (Sethian, 1996), (4) liver reconstruction based on the initial liver regions by a threshold-based level-set method (Hsu et al., 2010; Lefohn et al., 2003), and (5) surface smoothing of the reconstructed liver. An interactive function is provided for editing the reconstructed liver when necessary. A use scenario and its user interface were developed as shown in Figure 5 for the liver reconstruction module.
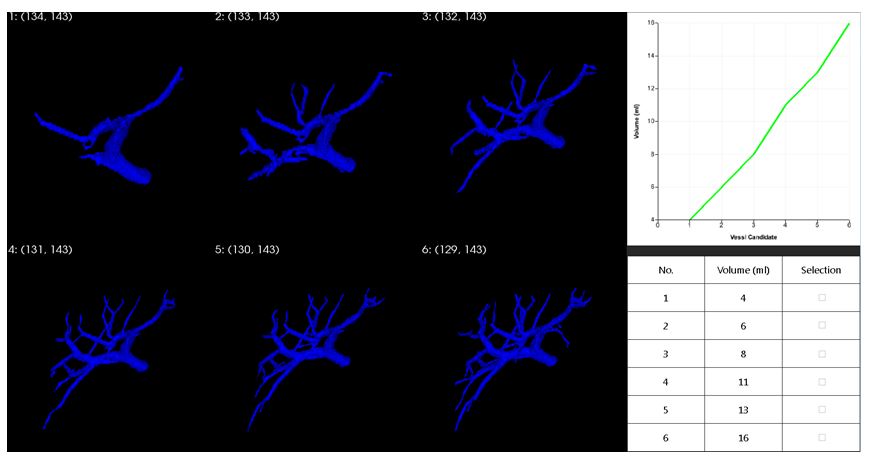
2.2.2 Vessel 3D reconstruction module
Liver vessels including hepatic artery (HA), portal vein (PV), hepatic vein (HV), and inferior vena cava (IVC) are reconstructed from CT images by a customized and efficient semi-automatic region growing method in five steps: (1) denoising and masking of CT images with the reconstructed liver regions, (2) selection of multiple seed points, (3) automatic identification of multiple threshold intervals based on analysis of intensity values of the selected seed points, (4) vessel extraction based on multiple threshold intervals by a region growing method, implemented in ITK (Ibanez et al., 2005), and (5) selection of the most appropriate extraction result. A popup window (Figure 6) was designed for showing the intermediate multiple reconstruction candidates with volume information to users to select the most appropriate result.
2.2.3 Tumor 3D reconstruction module
A tumor(s) is reconstructed in four steps: (1) denoising of CT images, (2) selection of multiple seed points, (3) identification of a threshold interval from the selected seed points, and (4) tumor reconstruction from the selected seed points with the identified threshold interval by a threshold-based level-set method (Hsu et al., 2010; Lefohn et al., 2003).
2.2.4 Liver anatomical segmentation module
Two options (plane-based and sphere-based segmentation methods) were provided for liver anatomical segmentation. A liver can be divided into eight segments according to the structures of hepatic and portal veins by the Couinaud classification model (Couinaud, 1957). A seven-step procedure was developed for liver anatomical segmentation in Dr. Liver: (1) formation of segment 1 by a segmentation sphere, (2) separation of the liver into left and right lobes according to Cantlie's line, (3) separation of the right lobe into anterior and posterior sectors, (4) separation of the left lobe into medial (or segment 4) and lateral sectors, (5) separation of the posterior sector into segments 6 and 7, (6) separation of the anterior sector into segments 5 and 8, and (7) separation of the lateral sector into segments 2 and 3. The liver segmentation can be conducted fully or partially according to a user's needs.
The plane-based segmentation method consists of (1) automatic generation of a segmentation plane and interactive adjustment of the plane and (2) confirmation of segmentation results according to a pre-assigned color scheme. The sphere-based segmentation method consists of (1) overlaying the liver mask over CT images, (2) removing a segment by a segmentation sphere, and (3) showing and saving segmentation results.
2.2.5 Surgery planning module
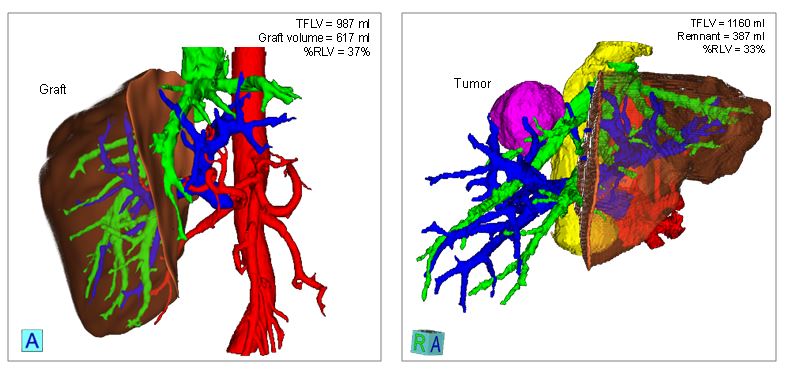
Three options (plane-based, segment-based, and sphere-based methods) were provided for liver surgery planning. The plane-based liver surgery planning module consists of (1) loading the reconstructed liver, vessels, and tumors, (2) interactively selecting three landmarks to form a cutting plane, (3) adjusting the cutting plane, and (4) volumetric measurement. Next, the segment-based liver surgery planning module consists of (1) loading liver segments, reconstructed vessels, and tumors and (2) interactively cutting the segments affected by the tumors and calculating the volume information. Lastly, the sphere-based liver surgery planning7 module consists of (1) loading the reconstructed liver mask, vessels, and tumors, (2) interactively cutting the liver by a resection sphere, and (3) saving surgery planning results and calculating volume information. Figure 7 shows surgery planning results for right hemihepatectomy in LDLT and tumor resection using the sphere-based liver surgery planning module.
2.3 Identifying usability problems of a preliminary version
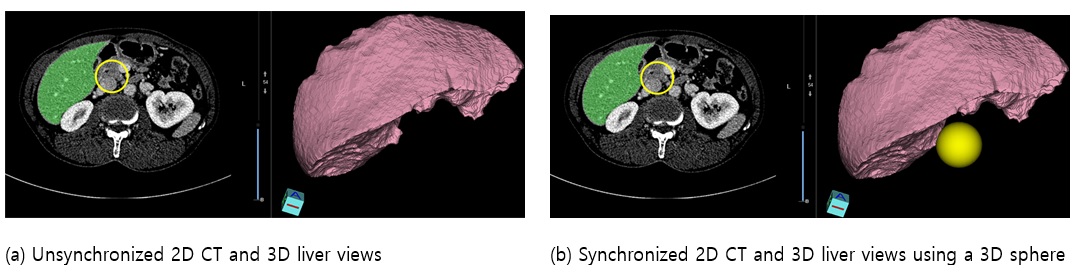
Usability problems of the preliminary version of Dr. Liver were identified and revised in the early development stage (Table 1). A regular meeting among ergonomists, algorithm developers, graphical user interface (GUI) designers, programmers, and three male liver surgeons (aged from 30s to 40s) was held every two or three weeks to evaluate the usability of the preliminary version of Dr. Liver. The ergonomists and surgeons were asked to use the updated system before each meeting. A video demo showing how to use the system was provided. During each meeting, opinions of the ergonomists and surgeons regarding likes, dislikes, and suggestions were collected and analyzed to identify usability problems. After each meeting, an improvement of the system was made by the algorithm developers, GUI designers, and programmers. For example, in the liver reconstruction module, surgeons reported that a 2D editing circle over the 2D CT image view in Figure 8.a should be synchronized with the 3D liver view for efficient editing navigation. Accordingly, a revision was made as illustrated in Figure 8.b to synchronize the 2D CT image view and the 3D liver view during liver contour editing. Then the revised system was sent to the ergonomists and surgeons for their evaluation until the next meeting. This usability evaluation process was performed iteratively until identified usability problems were resolved at a satisfactory level.
|
Modules |
Usability problems |
Improvements |
|
|
Liver reconstruction |
1. 2D CT view and 3D liver view should be synchronized during
liver contour editing 2. Hotkey menus should be provided for CT image manipulation such
as seed point selection, CT image zooming in/out, window/level adjustment,
contour editing, CT image translation, undo function, and transparency adjustment |
1. Synchronization between 2D CT and 3D model views for liver
contour editing 2. Providing hotkey menus on 2D CT screen for CT image
manipulation
|
|
|
Vessel reconstruction |
1. The vessels outside of the liver should 2. Manual adjustment of thresholds for 3. Repetition of vessel reconstruction procedure to identify an
appropriate threshold interval was cumbersome |
1. Using masked CT images with the extracted liver region to
remove surroundings of the liver 2. Semi-automatic thresholding from pixel values of interactively
selected seed points 3. Providing multiple candidates of extracted vessel trees for the
user to select an appropriate result |
|
|
Tumor reconstruction |
• Manual adjustment of
thresholds for |
• Semi-automatic thresholding
from pixel vales of interactively selected seed points |
|
|
Liver segmentation |
Plane-based |
• The relative location and
orientation of |
• Providing a cube box around
the segmentation plane to indicate location and orientation of the plane |
|
Sphere-based |
• The small sphere took long
time for liver segmentation |
• Providing a large sphere
instead of a small sphere for liver segmentation |
|
|
Liver surgery planning |
Plane-based |
• The relative location and
orientation of |
• Providing a cube box around
the resection plane to indicate location and orientation of the resection
plane |
|
Sphere-based |
• The small sphere took long
time for |
• Providing a large sphere
instead of a small sphere for virtual liver resection |
|
3. Usability Testing
A usability testing was performed to validate the effectiveness of the revised version of Dr. Liver and identify its usability problems. Seven male liver surgeons having no experience with Dr. Liver (aged from 30s to 50s) from two medical centers participated in the usability testing.
3.1 Usability testing procedures
The usability testing of Dr. Liver was performed in a secure room for each individual participant, administered by one test administrator. The usability testing consisted of three (pre-test, test, and post-test) sessions, which lasted 1.5 hours in total. At the pre-test session, a paper manual and demo video clips of Dr. Liver were provided to explain how to use Dr. Liver. Then, a practice was allowed for familiarization of Dr. Liver and an informed consent was obtained.
In the test session, five modules of usability evaluation were conducted in sequence: (1) liver reconstruction, (2) vessel reconstruction, (3) tumor reconstruction, (4) liver anatomical segmentation, and (5) liver surgery planning. During each test module, the performance of the participant was evaluated using various measures including accuracy metrics, task completion times, the number of mouse clicks, and the number of keystrokes. After testing each individual module, a questionnaire was provided to survey the participant's subjective assessment, likes, dislikes, and open suggestions. A 10-min break was offered after completing the first three modules.
Lastly, in the post-test session, debriefing was performed to learn more details of user behaviors. Questions raised from observations during the test session, such as tasks not completed and critical comments, were addressed and discussed.
3.2 Usability assessment measures and questionnaires
Different sets of performance and preference measures as shown in Table 2 were applied to each test module by considering task characteristics of each test module. For example, in the liver reconstruction module, the time to finish the liver reconstruction task, the number of mouse clicks, and the number of keystrokes were automatically measured by Dr. Liver. Then, similarity index (SI), false positive error (FPE), false negative error (FNE) of the extracted liver regions were measured by comparing to the golden standard (manually traced liver regions by a radiologist) for accuracy assessment (Yang et al., 2014). Next, %RLV was measured for safety assessment of the liver surgery plan. Ferrero et al. (2007) reported that liver resection surgery can be considered safe if %RLV > 27%. Lastly, seven subjective criteria (usefulness, ease of use, learnability, informativeness, clarity, tolerance, and overall satisfaction; You et al., 2008) were used to evaluate the participant's preference with Dr. Liver.
|
Modules |
Performance measures |
Preference measures |
||||||||||||||
|
Completion |
Number |
Number |
Similarity |
False |
False |
% RLV |
Usefulness |
Ease of |
Learnability |
Informa- tiveness |
Clarity |
Tolerance |
Satisfaction |
|
||
|
Liver
reconstruction |
○ |
○ |
○ |
○ |
○ |
○ |
○ |
○ |
○ |
○ |
○ |
○ |
○ |
|
||
|
Vessel |
Portal |
○ |
○ |
○ |
|
○ |
○ |
○ |
○ |
○ |
○ |
○ |
|
|||
|
Hepatic |
○ |
○ |
○ |
|
○ |
○ |
○ |
○ |
○ |
○ |
○ |
|
||||
|
Hepatic |
○ |
○ |
○ |
|
○ |
○ |
○ |
○ |
○ |
○ |
○ |
|
||||
|
IVC |
○ |
○ |
○ |
|
○ |
○ |
○ |
○ |
○ |
○ |
○ |
|
||||
|
Tumor
reconstruction |
○ |
○ |
○ |
○ |
○ |
○ |
○ |
○ |
○ |
○ |
○ |
○ |
○ |
|
||
|
Liver |
Plane- |
○ |
○ |
○ |
|
○ |
○ |
○ |
○ |
○ |
○ |
○ |
|
|||
|
Sphere- |
○ |
○ |
○ |
|
○ |
○ |
○ |
○ |
○ |
○ |
○ |
|
||||
|
Liver
surgery |
Plane- |
○ |
○ |
○ |
|
○ |
○ |
○ |
○ |
○ |
○ |
○ |
○ |
|
||
|
Segment- |
○ |
○ |
○ |
|
○ |
○ |
○ |
○ |
○ |
○ |
○ |
○ |
|
|||
|
Sphere- |
○ |
○ |
○ |
|
○ |
○ |
○ |
○ |
○ |
○ |
○ |
○ |
|
|||
Based on the evaluation measurement matrix table, usability assessment questionnaires were designed for each test module. Table 3 shows sample questions for subjective assessment of the liver reconstruction module.
3.3 Test results
3.3.1 Module 1: Liver reconstruction
The averages (SDs) of liver reconstruction time, the number of mouse clicks, and the number of keystrokes were 3.0 (0.5) min, 59.0 (8.8), and 17.3 (3.0), respectively (Table 4). A high accuracy of liver reconstruction was achieved (SI = 96.8 ± 0.4%; FPE = 2.4 ± 0.3%; FNE = 2.8 ± 0.3%). High evaluation scores were given for the usability of liver reconstruction module (Table 5) with an overall mean (SD) of 6.3 (0.6). A relatively low assessment of tolerance level (5.6 ± 0.8) in liver reconstruction was due to the absence of an undo function in seed point selection according to the participants' opinions.
|
No |
Questions |
Very |
Poor |
Slightly |
Fair |
Slightly good |
Good |
Very |
|
1 |
How useful is it for
extracting the liver |
① |
② |
③ |
④ |
⑤ |
⑥ |
⑦ |
|
2 |
How easy is it to use? |
① |
② |
③ |
④ |
⑤ |
⑥ |
⑦ |
|
3 |
How easy is it to learn
the steps of liver reconstruction? |
① |
② |
③ |
④ |
⑤ |
⑥ |
⑦ |
|
4 |
How adequate is the
information |
① |
② |
③ |
④ |
⑤ |
⑥ |
⑦ |
|
5 |
How clear are the step
names? |
① |
② |
③ |
④ |
⑤ |
⑥ |
⑦ |
|
6 |
How adequate is the
tolerance to allow |
① |
② |
③ |
④ |
⑤ |
⑥ |
⑦ |
|
No |
Questions |
Very dissatisfied |
Dissatisfied |
Slightly |
Neutral |
Slightly |
Satisfied |
Very |
|
7 |
What is your overall
satisfaction with the |
① |
② |
③ |
④ |
⑤ |
⑥ |
⑦ |
3.3.2 Module 2: Vessel reconstruction
The averages (SDs) of PV reconstruction time, the number of mouse clicks, and the number of keystrokes were 1.4 (0.2) min, 21.1 (4.5), and 10.4 (3.1), respectively (Table 4). High evaluation scores were given for the usability of PV reconstruction module (Table 5) with an overall mean (SD) of 6.2 (0.8).
The averages (SDs) of HA reconstruction time, the number of mouse clicks, and the number of keystrokes were 2.3 (0.3) min, 45.6 (6.5), and 17.7 (4.1), respectively (Table 4). The longer time and higher user workload of HA reconstruction than those of PV reconstruction were due to more interactive editing of HA reconstruction results. The average (SD) of the assessments of HA reconstruction module (Table 5) was 6.1 (0.8). A relatively low assessment of usability (5.7 ± 1.0) was due to more interactive editing of HA reconstruction results according to the participants' opinions.
The averages (SDs) of HV reconstruction time, the number of mouse clicks, and the number of keystrokes were 1.4 (0.2) min, 18.6 (7.3), and 5.4 (2.2), respectively (Table 4). High evaluation scores were given for the usability of HV reconstruction module (Table 5) with an overall mean (SD) of 6.2 (0.7).
The averages (SDs) of IVC reconstruction time, the number of mouse clicks, and the number of keystrokes were 1.4 (0.2) min, 19.0 (3.7), and 7.0 (3.3), respectively (Table 4). Consistently high evaluation scores were given for the usability of IVC reconstruction module (Table 5) with an overall mean (SD) of 6.2 (0.5).
3.3.3 Module 3: Tumor reconstruction
The averages (SDs) of tumor reconstruction time, the number of mouse clicks, and the number of keystrokes were 2.8 (0.3) min, 21.1 (5.3), and 4.7 (2.0), respectively (Table 4). A high accuracy of tumor reconstruction was achieved (SI = 97.3 ± 0.8%; FPE = 1.9 ± 0.2%; FNE = 2.3 ± 0.2%). Consistently high evaluation scores were given for the usability of tumor reconstruction module (Table 5) with an overall mean (SD) of 6.2 (0.6).
|
Modules |
Accuracy (%) |
Time (min) |
Number of mouse clicks |
Number of |
|||
|
Similarity |
False positive error |
False negative error |
|||||
|
Liver reconstruction |
96.8 (0.4) |
2.4 (0.3) |
2.8 (0.3) |
3.0 (0.5) |
59.0 (8.8) |
17.3 (3.0) |
|
|
Vessel reconstruction |
Portal vein |
- |
- |
- |
1.4 (0.2) |
21.1 (4.5) |
10.4 (3.1) |
|
Hepatic artery |
- |
- |
- |
2.3 (0.3) |
45.6 (6.5) |
17.7 (4.1) |
|
|
Hepatic vein |
- |
- |
- |
1.4 (0.2) |
18.6 (7.3) |
5.4 (2.2) |
|
|
IVC |
- |
- |
- |
1.4 (0.2) |
19.0 (3.7) |
7.0 (3.3) |
|
|
Tumor reconstruction |
97.3 (0.8) |
1.9 (0.2) |
2.3 (0.2) |
2.8 (0.3) |
21.1 (5.3) |
4.7 (2.0) |
|
|
Liver segmentation |
Plane-based |
- |
- |
- |
4.9 (0.4) |
42.6 (9.1) |
- |
|
Sphere-based |
- |
- |
- |
4.8 (0.3) |
23.3 (3.6) |
6.3 (2.1) |
|
|
Liver surgery |
Plane-based |
- |
- |
- |
2.1 (0.3) |
27.9 (5.6) |
3.7 (0.8) |
|
Segment-based |
- |
- |
- |
1.0 (0.2) |
6.0 (2.2) |
- |
|
|
Sphere-based |
- |
- |
- |
1.6 (0.2) |
12.3 (3.3) |
4.6 (1.7) |
|
3.3.4 Module 4: Liver anatomical segmentation
The averages (SDs) of plane-based liver segmentation time and the number of mouse clicks were 4.9 (0.4) min and 42.6 (9.1) respectively (Table 4). The average (SD) of the assessments of plane-based liver segmentation module was 5.3 (1.2). The participants' opinions indicated that the low assessment was due to difficulty in rotation and translation of a segmentation plane by the mouse.
The averages (SDs) of sphere-based liver segmentation time, the number of mouse clicks, and the number of keystrokes were 4.8 (0.3) min, 23.3 (3.6), and 6.3 (2.1), respectively (Table 4). Consistently high evaluation scores were given for the usability of sphere-based liver segmentation module (Table 5) with an overall mean (SD) of 6.5 (0.6).
3.3.5 Module 5: Liver surgery planning
The averages (SDs) of plane-based liver surgery planning time, the number of mouse clicks, and the number of keystrokes were 2.1 (0.3) min, 27.9 (5.6), and 3.7 (0.8), respectively (Table 4). The average (SD) of %RLV was 33.0% (2.0%). High evaluation scores were given for the usability of the plane-based liver surgery planning module (Table 5) with an overall mean (SD) of 6.2 (0.8). A relatively low assessment of tolerance level (5.6 ± 1.0) in plane-based liver surgery planning was due to the absence of an undo function in rotation and translation of a resection plane.
The averages (SDs) of segment-based liver surgery planning time and number of mouse clicks were 1.0 (0.2) min and 6.0 (2.2), respectively (Table 4). High evaluation scores were given for the usability of the segment-based liver surgery planning module (Table 5) with an overall mean (SD) of 6.1 (0.5). The average (SD) of %RLV was 34.3% (1.7%). A relatively low assessment of usefulness (5.7 ± 0.5) in segment-based liver surgery planning was due to no need for detailed liver segmentation in clinical practice according to the participants' opinions.
The averages (SDs) of sphere-based liver surgery planning time, the number of mouse clicks, and the number of keystrokes were 1.6 (0.2) min, 12.3 (3.3), and 4.6 (1.7), respectively (Table 4). The average (SD) of %RLV was 34.4% (1.9%). Consistently high evaluation scores were given for the usability of the sphere-based liver surgery planning module (Table 5) with an overall mean (SD) of 6.4 (0.7).
|
Modules |
Preference
measures |
||||||||
|
Usefulness |
Ease
of |
Learnability |
Informa- tiveness |
Clarity |
Tolerance |
Satisfaction |
Overall
preference |
||
|
Liver
reconstruction |
6.4 (0.5) |
6.4 (0.5) |
6.4 (0.5) |
6.4 (0.5) |
6.6 (0.5) |
5.6 (0.8) |
6.3 (0.5) |
6.3 (0.6) |
|
|
Vessel
reconstruction |
Portal
vein |
6.4 (0.5) |
6.1 (0.7) |
6.3 (0.8) |
6.1 (0.7) |
6.6 (0.5) |
5.6 (1.3) |
6.0 (0.6) |
6.2 (0.8) |
|
Hepatic
artery |
6.0 (0.8) |
5.7 (1.0) |
6.0 (1.0) |
5.9 (0.9) |
6.3 (0.5) |
5.6 (0.5) |
6.0 (0.6) |
6.1 (0.8) |
|
|
Hepatic
vein |
6.4 (0.5) |
6.3 (0.5) |
6.4 (0.8) |
6.1 (0.7) |
6.4 (0.5) |
5.7 (1.0) |
6.1 (0.4) |
6.2 (0.7) |
|
|
IVC |
6.4 (0.5) |
6.1 (0.4) |
6.4 (0.5) |
6.0 (0.8) |
6.4 (0.5) |
5.9 (0.4) |
6.0 (0.0) |
6.2 (0.5) |
|
|
Tumor
reconstruction |
6.0 (0.0) |
6.3 (0.5) |
6.0 (0.8) |
6.0 (0.8) |
6.3 (0.5) |
6.6 (0.5) |
6.3 (0.5) |
6.2 (0.6) |
|
|
Liver
segmentation |
Plane-based |
6.0 (0.0) |
4.6 (1.5) |
4.6 (1.5) |
5.6 (0.5) |
6.0 (0.0) |
5.0 (1.4) |
5.6 (1.3) |
5.3 (1.2) |
|
Sphere-based |
6.6 (0.5) |
6.6 (0.5) |
6.0 (1.0) |
6.6 (0.5) |
6.6 (0.5) |
6.6 (0.5) |
6.6 (0.5) |
6.5 (0.6) |
|
|
Liver
surgery |
Plane-based |
6.3 (0.5) |
6.3 (0.8) |
6.0 (1.0) |
6.3 (0.5) |
6.6 (0.5) |
5.6 (1.0) |
6.3 (1.0) |
6.2 (0.8) |
|
Segment-based |
5.7 (0.5) |
7.0 (0.0) |
6.0 (0.0) |
6.0 (0.0) |
6.3 (0.5) |
6.0 (0.0) |
6.0 (0.0) |
6.1 (0.5) |
|
|
Sphere-based |
6.7 (0.5) |
6.3 (1.0) |
6.3 (0.8) |
6.4 (0.5) |
6.7 (0.5) |
6.0 (0.8) |
6.1 (0.7) |
6.4 (0.7) |
|
The present study developed the user-centered 3D VLS planning system Dr. Liver to support safe and rational liver surgery. A use scenario, user interfaces, and image processing algorithms were developed and implemented to Dr. Liver to provide good usability and accurate information within an acceptable time (< 30min) to surgeons in preoperative liver surgery planning. The high-level and low-level tasks in Dr. Liver are performed in a hierarchical and sequential manner with customized user interfaces with various user friendly features such as hotkey menus provided on the screen of Dr. Liver to reduce the workload of users, and 3D view indication box and resetting buttons provided for easy navigation of views. Furthermore, Dr. Liver allows surgeons to inspect and edit the analysis results with overlaid CT images. The entire processing time of Dr. Liver (< 30min) for liver surgery planning can be acceptable to surgeons in the clinical setting. The safety level of the developed system (%RLV = 34%) was higher than the safety margin (%RLV = 27%) proposed by Ferrero et al. (2007).
The iterative usability evaluation and improvement process in the early development stage practically contributed to the development of Dr. Liver in terms of shortening development time and improving its usability. Close collaboration between developers (ergonomists, GUI designers, algorithm developers, and programmers) and users (medical surgeons) by having an evaluation meeting every two weeks facilitated efficient identification and immediate improvement of usability problems of Dr. Liver. Early identification and resolving of usability problems contributed to an efficient system development process by shortening development cycle and therefore saved time and cost in Dr. Liver development.
The present study proposed a comprehensive and systematic usability evaluation procedure with a customized metric system consisting of various performance measures (completion time, SI, FPE, FNE, %RLV, the number of mouse clicks, and the number of keystrokes) and preference measures (usefulness, ease of use, learnability, informativeness, clarity, tolerance, and overall satisfaction) for usability evaluation of Dr. Liver. Usability testing is an analytical and comprehensive way to identify usability problems of Dr. Liver and develop recommendations for improving usability of Dr. Liver in a systematic manner. From the usability test, potential usability problems of Dr. Liver were identified and improvements could be made efficiently to solve the identified usability problems. The proposed usability evaluation method can be applied to other medical programs such as a brain surgery planning system and a plastic surgery planning system.
The present study demonstrated the application of usability testing as an effective tool throughout the development process of Dr. Liver. By applying the concepts and techniques of usability testing, the liver surgery planning system Dr. Liver with various user-friendly features was developed, usability problems of the system were screened, recommendations and revisions on the system for better usability were produced in an effective, systematic manner.
The present study evaluated the usability of Dr. Liver with ten liver surgeons who can be considered as professional users for the liver surgery system. However, opinions of general users such as medical students, physician assistants, and nurses who may use the system for education and/or assistance to liver surgeons can be also valuable. A further study is needed to include general users in usability evaluation of Dr. Liver.
References
1. Chen, Y.-W., Kaibori, M., Shindo, T., Miyawaki, K., Foruzan, A.H., Tateyama, T., Han, X.-H., Matsui, K., Tsuda, T. and Kwon, A-H.,
Crossref
Google Scholar
2. Couinaud, C., Le foie: Etudes anatomiques et chirurgicales. Masson, Paris, France, 1957.
Crossref
3. Debarba, H.G., Zanchet, D.J., Fracaro, D., Maciel, A. and Kalil, A.N.,
Crossref
Google Scholar
4. Ferrero, A., Viganò, L., Polastri, R., Muratore, A., Eminefendic, H., Regge, D. and Capussotti, L., Postoperative liver dysfunction and future remnant liver: where is the limit? Results of a prospective study. World Journal of Surgery, 31(8), 1643-1651, 2007.
Crossref
5. Hsu, C.-Y., Yang, C.-H. and Wang, H.-C., Multi-threshold level set model for image segmentation. EURASIP Journal on Advances in Signal Processing, 1-9, 2010.
Crossref
Google Scholar
6. Ibanez, L., Schroeder, W., Ng, L. and Cates, J., The ITK software guide 2.4, New York, NY: Kitware Inc, 2005.
Crossref
7. ISO 9241-11, Ergonomic requirements for office work with visual display terminals (VDTs) - Part 11: Guidance on usability, 1998.
Crossref
8. Lefohn, A.E., Cates, J.E. and Whitaker, R.T., Interactive, GPU-based level sets for 3D segmentation. In: Proceedings of the 6th International Conference of Medical Image Computing and Computer-Assisted Intervention, Lecture Notes in Computer Science, 2878, 564-572. Berlin: Springer Verlag, 2003.
Crossref
Google Scholar
9. Nielsen, J., Usability Engineering, Academic Press, Boston, Mass, USA, 1993.
Crossref
10. Perona, P. and Malik, J., Scale-space and edge detection using anisotropic diffusion. IEEE Transactions on Pattern Analysis and Machine Intelligence, 12(7), 629-639, 1990.
Google Scholar
11. Reitinger, B., Bornik, A., Beichel, R. and Schmalstieg, D., Liver surgery planning using virtual reality. IEEE Computer Graphics and Applications, 26(6), 36-47, 2006.
Crossref
PubMed
12. Schindl, M.J., Redhead, D.N., Fearon, K.C.H., Garden, O.J. and Wigmore, S.J., The value of residual liver volume as a predictor of hepatic dysfunction and infection after major liver resection. Gut, 54(2), 289-296, 2005.
Crossref
Google Scholar
13. Sethian, J.A.,
Crossref
Google Scholar
14. Shevchenko, N., Seidl, B., Schwaiger, J., Markert, M. and Lueth, T.C.,
Crossref
Google Scholar
15. Sorantin, E., Werkgartner, G., Beichel, R., Bornik, A., Reitinger, B., Popovic, N. and Sonka, M., Virtual Liver Surgery Planning. In: Neri, E., Caramella, D., Bartolozzi, C. (Eds.), Image processing in radiology - current applications, Berlin: Springer Verlag, pp. 411-418, 2008.
Crossref
Google Scholar
16. Yang, X., Yu, H.C., Choi, Y., Lee, W., Wang, B., Yang, J., Hwang, H., Kim, J.H., Song, J., Cho, B.K. and You, H., A hybrid semi-automatic method for liver segmentation based on level-set methods using multiple seed points. Computer Methods and Programs in Biomedicine, 113(1), 69-79, 2014.
Crossref
Google Scholar
17. You, H., Young, R. and Lee, M.W., Development and usability testing of an operating manual for a hair-braiding machine. Human Factors Ergonom. Manuf. Service Ind., 18(1), 1-13, 2008.
Crossref
Google Scholar
PIDS App ServiceClick here!